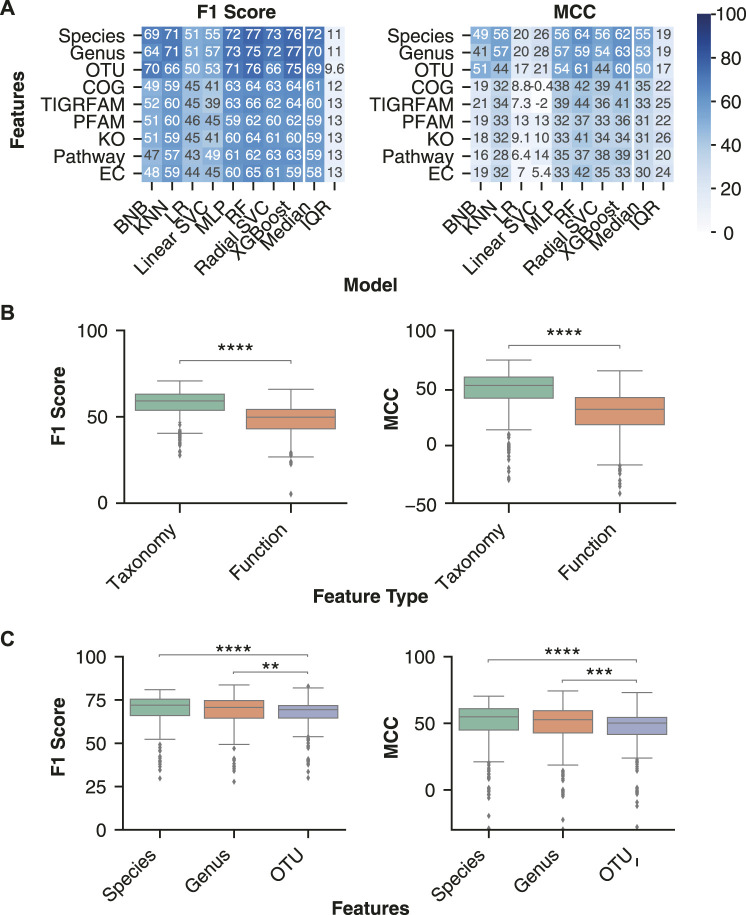
FIGURE 3.
Optimal disease classification of microbiome samples obtained with taxonomic features. (A) Median performance of the three taxonomy and six functional feature sets for each ML model architecture. Rows were sorted in descending order by the mean column followed by the standard deviation (SD) column. (B) Distribution of performance metrics for taxonomy and functional features across all normalization or transformation, batch effect correction, and model combinations. (C) Distribution of classification performance with the three taxonomic feature sets. Independent Mann-Whitney U tests were performed to compare aggregate performance of taxonomy and functional features. The analysis was limited to all normalizations and transformations (ILR, CLR, VST, ARS, LOG, TSS, NOT) and batch effect correction (only no batch effect correction or zero centering) methods that were performed on all feature sets. ** indicates p-value < 0.01, *** indicates p-value < 0.001, **** indicates p-value < 0.0001.

