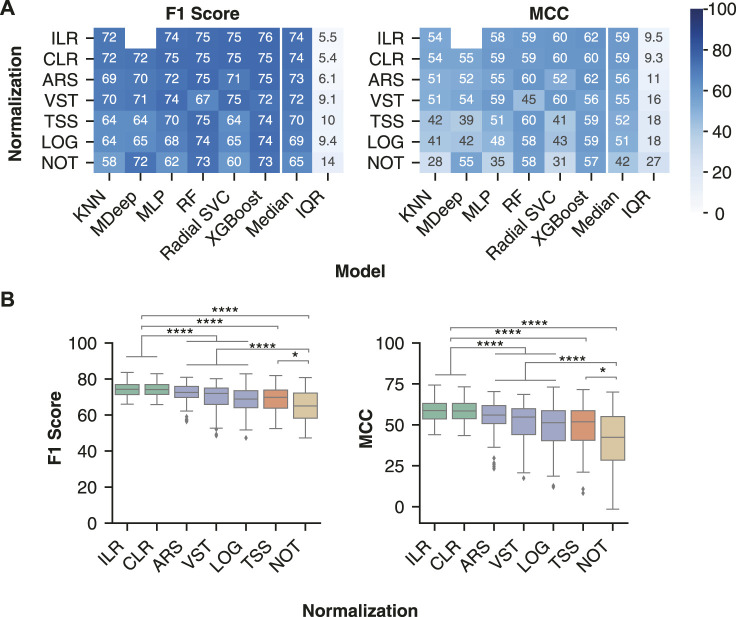
FIGURE 4.
Compositional transformation methods lead to the highest model performance for IBD classification. (A) Median model performance with each normalization or transformation method across all batch effect correction methods. (B) Distribution of classification performance of different classes of normalization methods. The compositional category consists of CLR and ILR (green), variance/distribution modifiers consist of VST, ARS, and LOG(blue), scaling consists of TSS (orange), and no normalization consists of NOT (brown). Classification performance following data processing with all pairwise combinations of the normalization or transformation methods (ILR, CLR, LOG, ARS, VST, TSS and NOT) and batch effect correction methods (No batch effect correction, MMUPHin #1, MMUPHin #2, ComBat-seq #1, ComBat-seq #2, and Zero-Centering) were included. Rows were sorted in descending order by the median of each performance metric across the non-linear models. No analysis was performed for MDeep paired with ILR as the ILR normalized values no longer map directly to a feature, therefore removing the phylogenetic structure required for MDeep. **** indicates p-value < 0.0001 and * indicates p-value < 0.05.

