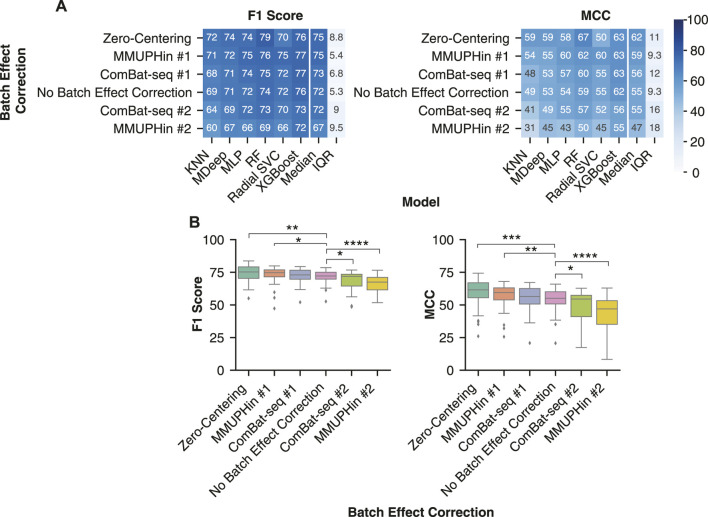
FIGURE 6.
Removing batch effects with zero-centering improved IBD classification. (A) Median performance of each batch effect correction method across all combinations of normalization or transformation methods, taxonomic features, and non-linear ML models. Rows were sorted in descending order by the median performance across all non-linear models. (B) Distribution of IBD classification performance following batch effect correction by the six different methods. All batch effect corrections were compared with a Mann-Whitney U test to the No Batch Effect Correction performance and the significant comparisons were labelled. * indicates p-value < 0.05, ** indicates p-value < 0.01, *** indicates p-value < 0.001, and **** indicates p-value < 0.0001.

