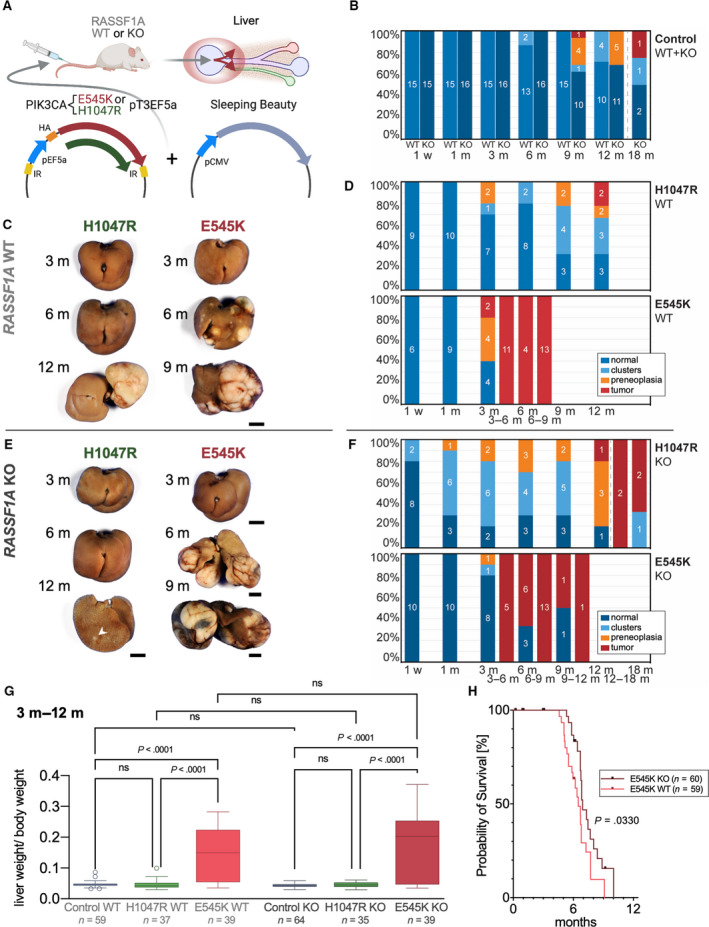
Fig. 1.

Hydrodynamic injection of PIK3CA‐mutated forms in the mouse liver drives hepatocarcinogenesis irrespective of RASSF1A background. (A) Scheme of hydrodynamic tail vein injections of PIK3CA mutant forms E545K or H1047R in conjunction with a plasmid encoding sleeping beauty transposase into either RASSF1A WT or KO mice leading to preferential transfection of pericentral hepatocytes as indicated by the red circle and arrows in the liver scheme. (B) Stacked bar charts showing the occurrence frequency of clear‐cell clusters, PREs, and tumors as well as normal‐appearing liver tissue (specified in the legend) at noted time points based on histological examination in RASSF1A WT versus KO mice in combined injection control groups (untreated, PBS‐injected, and EV‐injected mice). Central digits specify the number of observed animals in the respective classification subgroups. The dashed line is indicative of an extended observation period for four RASSF1A KO mice. (C) Representative gross images of livers of RASSF1A WT mice injected with PIK3CA mutant forms H1047R and E545K at indicated time points. Scale bar: 0.5 cm. (D) Stacked bar charts visualizing the frequency of occurrence of neoplastic lesions (specified in the legend) in PIK3CA H1047R and E545K‐injected RASSF1A WT mice. (E) Representative gross images of livers of RASSF1A KO mice injected with PIK3CA mutant forms H1047R and E545K at noted time points. The arrowhead points at a small tumor. Scale bars: 0.5 cm. (F) Stacked bar charts visualizing the frequency of occurrence of neoplastic lesions (specified in the legend) in PIK3CA H1047R and E545K‐injected RASSF1A KO mice at noted time points. (G) Diagram comparing the ratio of liver weight and body weight as tumor burden surrogate for combined time points ranging from 3 to 12 months in the respective PIK3CA injection groups sorted by RASSF1A background. Tukey method box plots are displayed. A Kruskal–Wallis test was calculated. (H) Kaplan–Meier survival curves (euthanasia based on termination criteria) of RASSF1A WT and KO mice from PIK3CA E545K injection group. Log‐rank test showed a minor significant longer survival time in KO than WT mice (P = 0.0330). Mice number in each arm is labeled in the figure legend.
