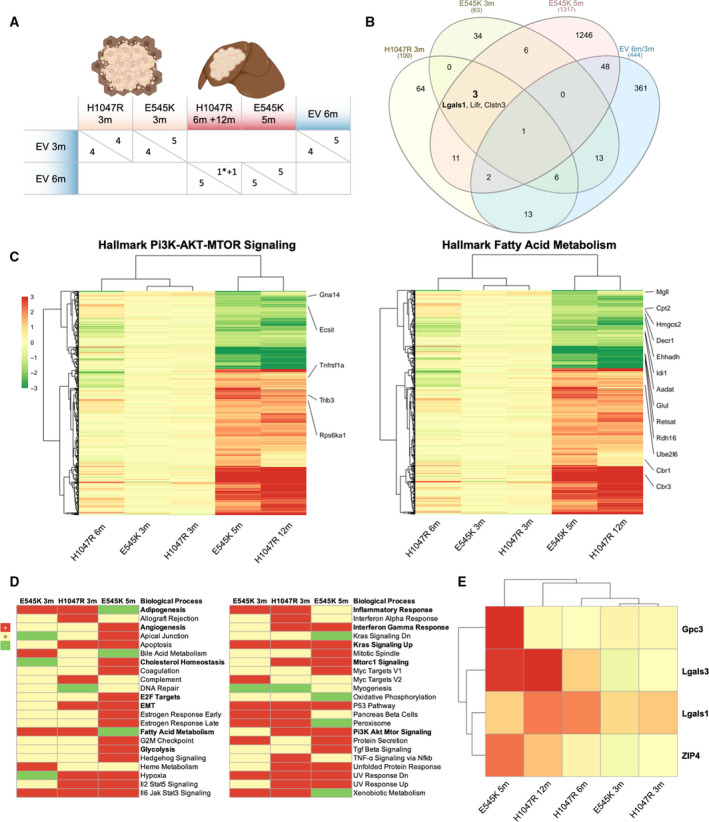
Fig. 4.

Metabolic signatures and identification of the novel effectors Gal‐1, Gal‐3, and ZIP4 in PIK3CA‐dependent hepatocarcinogenesis. (A) Overview of samples and comparison groups for cDNA microarray analysis. Preneoplastic lesions were compared to age‐matched controls injected with the EV. EV‐injected 3‐month time points were contrasted to EV‐injected 6 months to rule out age‐dependent effects. Only one tumor at 12 months was available from the H1047R injection arm. The asterisk indicates a PIK3CA H1047R‐induced confluent preneoplastic lesion analyzed at 6 months. (B) Venn diagram of cDNA microarrays exhibiting overlap of regulated genes in the prespecified comparison groups. Selection criteria were Log1.5 change and P < 0.01 for H1047R 3 months, E545K 3 months and control 6 versus 3 months, Log2 fold change and adj P < 0.05 for E545K 5 months. The numbers of overlapping and uniquely altered genes are given. The three genes conjointly called in the PIK3CA injection groups are mentioned, while Lgals1 encoding for Gal‐1 is written in bold. (C) Heatmap of differentially expressed genes with selection criteria |log2FC| > 1, adj. P < 0.05 and counts > 3 as determined in the E545K 5 months of comparison group. Specified genes are comprised in the GSEA hallmark gene sets PI3K‐AKT‐MTOR signaling (left panel) and fatty acid metabolism (right panel). Gradient scale color codes for Log2 fold change. A cluster dendrogram is shown on the left and above. (D) GSEA was performed to identify significantly upregulated (red) or downregulated (green) biological processes in PIK3CA E545K 3 months, H1047R 3 months, and E545K 5 months of injection groups. Particularly relevant processes implicated with hepatocarcinogenesis are reported in bold. (E) Target genes glypican‐3 (Gpc3), Lgals‐3 (Gal‐3), and ZIP4 fulfilled the selection criteria prementioned above in (B) and (C). LGALS1 (Gal‐1) met the selection criteria described in (B). Gpc3 serves as an internal positive control as upregulation is expected in HCC. Target genes were manually chosen based on novelty, potential pharmacological targetability (Gal‐1 and Gal‐3), and early upregulation in preneoplastic lesions (Gal‐1). Presentation as a heatmap with identical color‐coding as in Panel (C).
