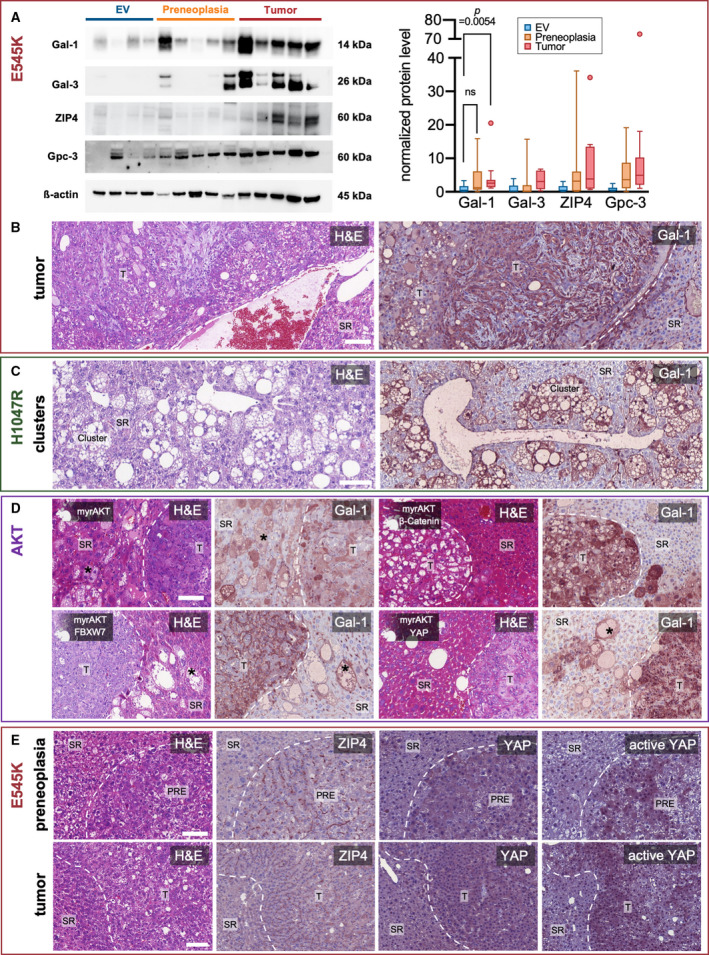
Fig. 5.

Validation of target proteins and early upregulation of galectin‐1 in precancerous lesions. (A) Western blot analysis demonstrating increased band intensities for Gal‐1, Gal‐3, ZIP4, as well as glypican‐3 (Gpc3) in tumorous and in part also in precancerous liver tissue (left panel) in PIK3CA E545K‐injected mice, as compared to empty vehicle injections. β‐actin was used as a loading control. Molecular weights of observed bands are marked on the right. Western blot quantification of band intensities normalized on corresponding β‐actin signals (right panel) yielded a significant increase in Gal‐1 intensity of tumors versus preneoplastic lesions (N = 3 western blot repeats). Kruskal–Wallis test was used. Tukey method box‐and‐whisker plots are displayed (ns = not significant; P > 0.05). Quantification of two western blot repeats each is shown adjacently for the remaining target proteins. (B) Gal‐1 immunohistochemistry of a PIK3CA E545K injection‐induced tumor with spindle cell and steatotic components shown in one mouse, representative for a total 10 stained mice. Scale bar: 100 µm. (C) Gal‐1 immunohistochemistry of preneoplastic pericentral clusters resulting from PIK3CA H1047R injection. Representative for a total of 5 mice stained. Scale bar: 100 µm. (D) Gal‐1 overexpression in various mouse models generated by hydrodynamic tail vein injections of either activated AKT with myristoylation sequence alone or in conjunction with β‐Catenin, FBXW7, and YAP. One animal in each injection group was exemplarily stained and is shown here. Asterisks (*) point out preneoplastic single cells. Scale bar: 100 µm. (E) ZIP4, YAP, and active YAP immunohistochemistry of a preneoplastic lesion (upper row) and a tumor (lower row) developing in a PIK3CA E545K‐injected mouse. Note the increased membranous expression of ZIP4 in contrast to surrounding liver tissue. A total of four mice were stained with visually similar results. Scale bars: 100 µm. PRE, preneoplasia; T, tumor.
