Fig. 6.

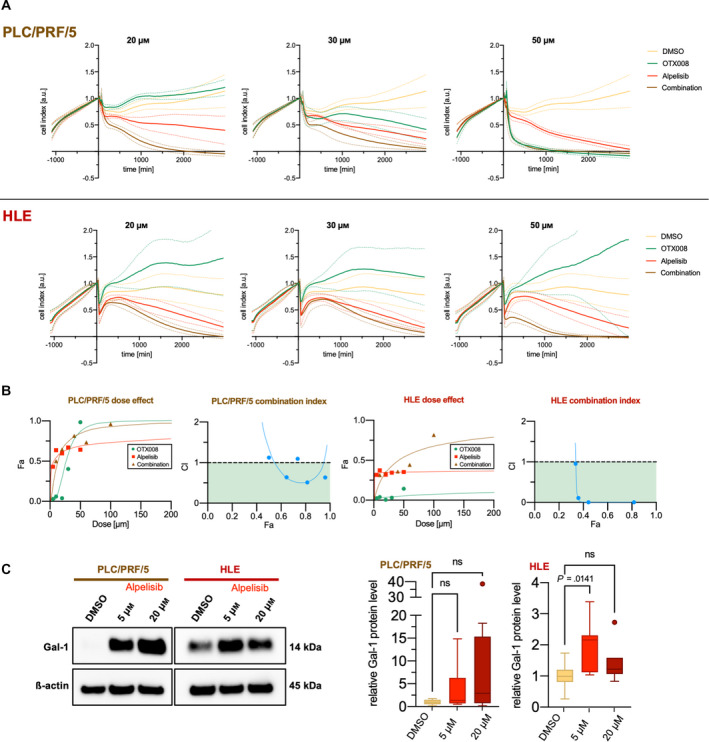
Strong synergism of Gal‐1 inhibitor OTX008 and PIK3CA inhibitor alpelisib in human HCC cell lines. (A) Time‐dependent proliferation and cytotoxicity profiles generated by impedance measurements using an xCELLigence® device. PLC/PRF/5 cells are shown in the upper row, HLE in the lower row. Addition of matched DMSO, OTX008, alpelisib at timepoint 0 in the outlined concentration either as a single or combined treatment after initial outgrowth for ~ 24 h. The cell index was normalized to the timepoint of drug addition. Solid lines signify mean and dashed lines 95% confidence interval. The illustrated data consist of three experimental repeats with 2–3 replicates acquired for each cell line and concentration. (B) CompuSyn®‐software calculation results to determine drug synergism of OTX008 and alpelisib in PLC/PRF/5 (two left panels) and HLE (two right panels). Values obtained by xCELLigence® cell viability analysis at 24 h were employed, and the results of one representative experiment are shown. Dose–effect curves (Fa = fraction affected), and corresponding combination index plots are provided. A combination index (CI) < 1 is interpreted as synergism. CI values of < 1 (colored in green), 1, > 1 can be interpreted as synergistic, additive, and antagonistic effects, respectively. (C) Exemplary western blot illustrating a tendency of increased Gal‐1 levels in response to alpelisib treatments in the HCC cell lines PLC/PRF/5 and HLE (left panel). A quantification of three treatment repeats with 2–3 replicates each was undertaken (right panel). Kruskal–Wallis test was used; ns, not significant.
