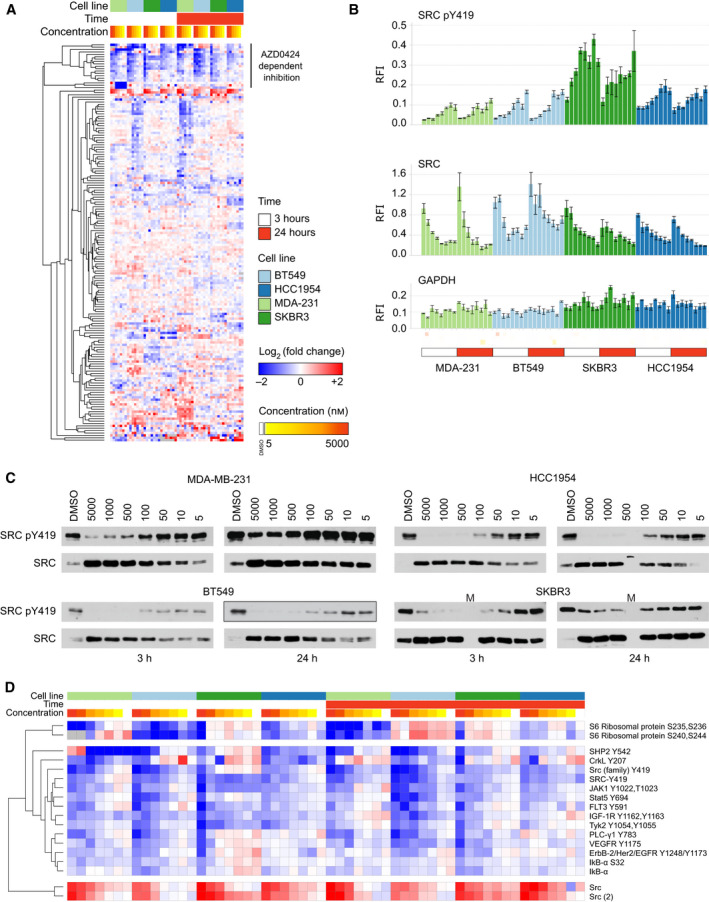
Fig. 2.

RPPA profiling of breast cancer cell lines treated with AZD0424. (A), RPPA profiling of AZD0424‐treated breast cancer cell lines. (B) RPPA profiling of total and phosphorylated SRC (Tyr419) in breast cancer cells treated with AZD0424. Mean relative fluorescence intensity (RFI) is shown ± SD (n = 3 technical replicates). (C) Western blot analysis of cell lysates from breast cancer cell lines treated with AZD0424 probed with anti‐SRC and anti‐SRC pY419 antibodies. (D) Cluster of antibodies that display AZD0424 concentration‐dependent inhibition from (A).
