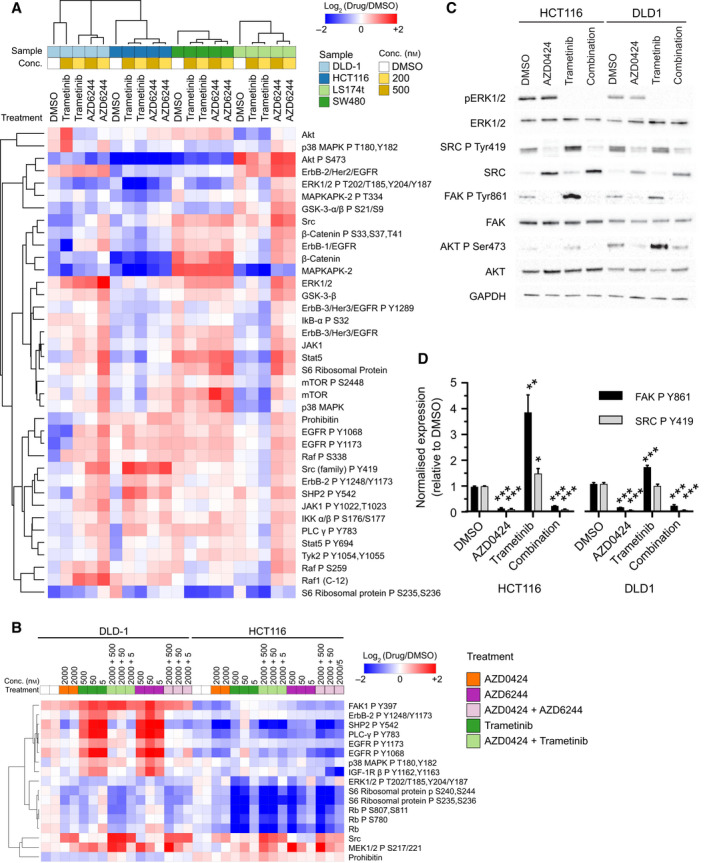
Fig. 3.

MEK inhibitors activate SRC signalling in KRAS‐G13D mutant CRC cell lines. (A) Heatmap showing RPPA profiling of colorectal cell lines treated with MEK inhibitors for 24 h. RFI values are normalised to the average DMSO value across all cell lines per antibody. (B) RPPA profiling of HCT116 and DLD1 cell lines treated with AZD0424 alone or in combination with the MEK inhibitors trametinib or AZD6244 for 24 h. In both (A) and (B), hierarchal clustering using Euclidean distance and complete linkage is shown. Values are normalised to DMSO‐treated samples. (C) Western blot analysis of signalling changes following treatment with AZD0424 (2000 nm) and or trametinib (5 nm) treatment for 24 h. (D) Quantification of western blot changes for phosphorylated SRC Tyr419 and FAK Tyr861. Mean ± SEM is shown (n = 3 independent experiments). *P < 0.05; **P < 0.01; ***P < 0.001 (one‐way ANOVA).
