
Fig. 1.
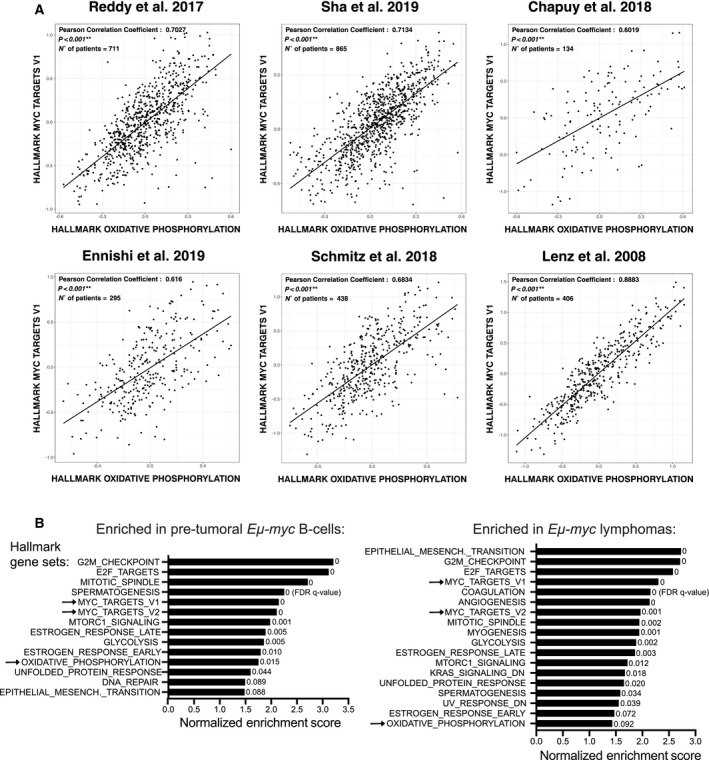
MYC activity positively correlates with the expression of OxPhos‐associated genes. (A) Correlation between the Hallmark‐OxPhos and MYC‐V1 gene sets across gene expression profiles from six independent human DLBCL patient cohorts [3, 4, 5, 22, 23, 24]. The X and Y axes report the mean expression of all genes in the indicated signature, in each patient sample (dots). Black lines represent linear regression fits to the data points. (B) Biological processes enriched during Eµ‐myc driven lymphomagenesis. Our previous RNA‐seq data [45] were used to address the enrichment of gene sets from the Hallmark collection and the CCC model [2] in pretumoral Eµ‐myc B cells (left) and lymphomas (right), relative to control nontransgenic B cells. The plot shows the enriched genes signatures (FDR q‐value < 0.1), ranked according to their normalized enrichment score. Only a subset of the Hallmark‐associated biological pathways, but none of the CCC signatures, reached this threshold. The arrows indicate the MYC target and OxPhos gene signatures.