
Fig. 5.
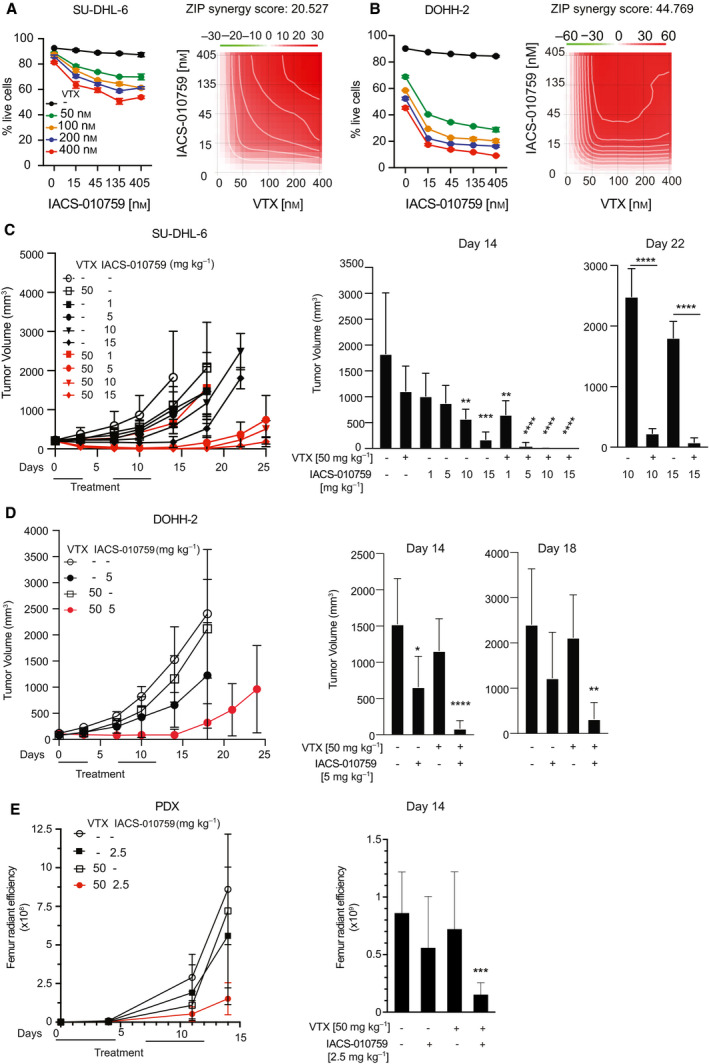
Combinatorial action of IACS‐010759 and BH3‐mimetic compounds against MYC‐associated lymphomas. (A) Left: percentage of live SU‐DHL‐6 cells after 24 h treatment with the indicated concentrations of IACS‐010759 and venetoclax (VTX). Error bars: SD (n = 3). Right: drug interaction landscape and synergy score for the two drugs calculated according to the ZIP model. Note that a positive ZIP score (> 10) signifies a synergistic interaction. The landscape identifies the doses at which the drugs either synergize (red) or antagonize each‐other (green)—the latter not observed here. (B) As in (A), for DOHH‐2 cells. (C) Tumor progression in CD1 nude mice bearing subcutaneous SU‐DHL‐6 tumors treated by oral gavage with the indicated daily doses of IACS‐010759 and/or venetoclax. Tumor volumes (mm3) were monitored at the indicated time‐points. Error bars: SD; n = 5 animals per group. The mean values, standard deviations and statistical significance for individual groups are visualized on the right: *P < 0.05; **P < 0.01; ***P < 0.001; ****P < 0.0001 (one‐way ANOVA relative to the untreated control at day 14, to the VTX‐only group at day 22). (D) As in (C) for subcutaneous DOHH‐2 tumors (all relative to untreated control). (E) Tumor progression in NSG mice injected with the luciferase‐positive PDX line DFBL‐20954‐V3‐mCLP. Tumor development in individual mice was monitored by in vivo imaging through quantification of bilateral femur radiant efficiency. After randomization, the animals were subjected to treatment with 2.5 mg·kg−1 IACS‐010759 and/or 50 mg·kg−1 venetoclax (VTX). Error bars: SD; n = 4/5 animals per group. Right: mean values and SD at day 14; ***P < 0.001 (one‐way ANOVA).