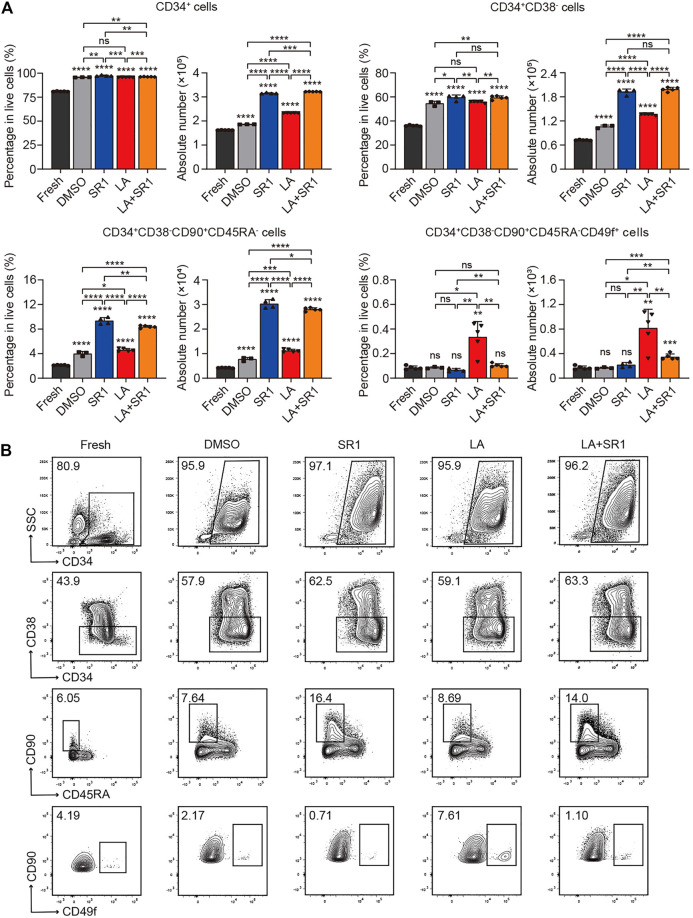
FIGURE 2.
LA promoted expansion of UCB HSCs in vitro. (A) The percentages in live cells and absolute number of CD34+, CD34+CD38−, CD34+CD38−CD45RA−CD90+ and CD34+CD38−CD45RA−CD90+CD49f+ subpopulations before (fresh, n = 5) and after a serum-free 4 days culture with DMSO (0.05%, v/v) (n = 3), SR1 (1 µM) (n = 4), LA (10 µM) (n = 5), or LA + SR1 (n = 5). All data represent the means ± SD. Compared with fresh unless specified. *p < 0.05, **p < 0.01, ***p < 0.001, ****p < 0.0001 and ns = not significant by two-tailed unpaired Students’ t-test. (B) Representative FACS profiles of phenotypically defined subpopulations in cultured CD34 + cells as described in (A).

