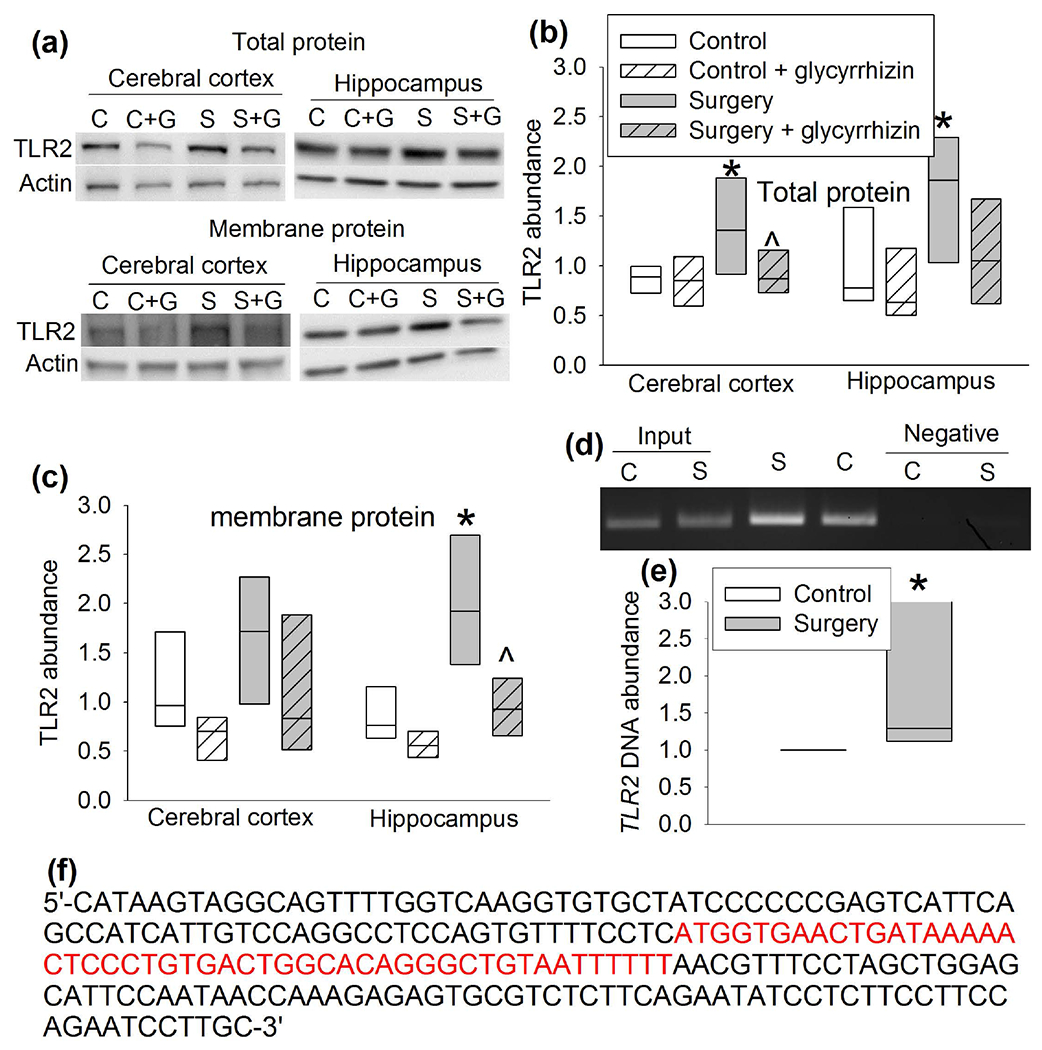
Figure 8.

HMGB1 regulated TLR2 expression. CD-1 mice were subjected to right carotid artery exposure under isoflurane anesthesia and treated with or without glycyrrhizin. Cerebral cortex and hippocampus were harvested 6 h after the surgery. (a) Representative Western blotting images of total or membrane protein. (b) Quantitative results of TLR2 abundance in total protein. (c) Quantitative results of TLR2 abundance in membrane protein. (d) Representative images of the PCR products of tlr2 gene fragment (−283 bp to −71 bp). The first two lanes are input controls and the last two lanes are negative IgG controls. (e) Quantitative results of the PCR products of tlr2 gene fragment (−283 bp to −71 bp). These PCR results were not normally distributed (P < 0.05 by Kolmogorov-Smirnov test for normality). (f) The sequence of the segment of the tlr2 gene that was immunoprecipitated by an anti-HGMB1 antibody. The presumed binding sequence for HGMB1 is in red. Results are in box plot format (n = 6 for panels b and c, = 15 for panel e; the n number referred to the number of animals). ● : lowest or highest score (the score will not show up if it falls in the 95th percentile); between lines: 95th percentile of the data; inside boxes: 25th to 75th percentile including the median of the data. * P < 0.05 compared with control. ^ P < 0.05 compared with surgery alone. C: control, S: surgery.
