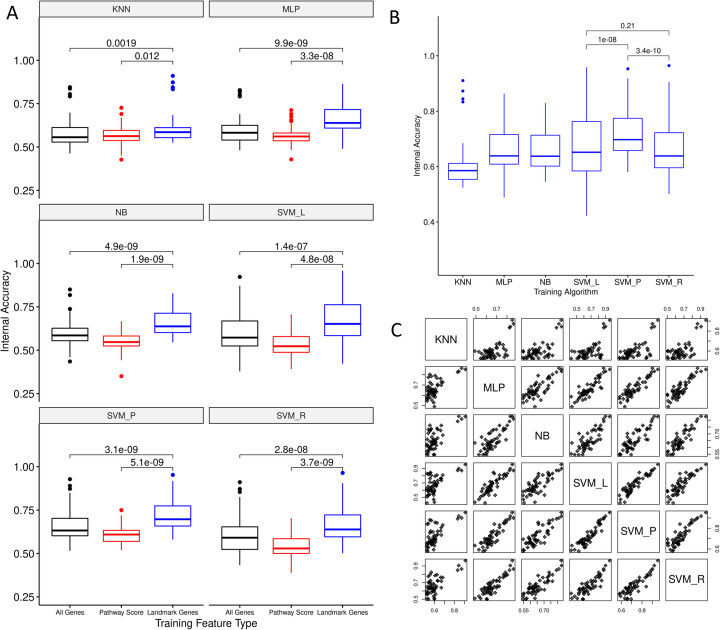
Fig. 3.
Comparison of internal accuracy scores across input feature types and training algorithms. A) Distributions of internal accuracies for 51 MCF7-trained MIE classifiers are shown as box-and-whisker plots for each combination of 6 classification algorithms and 3 input feature types. Each box spans the inter-quartile range, with the thicker line indicating the median. Whiskers on each plot indicate the range of data within 1.5x IQR beyond the upper and lower quartiles, and outlier data points beyond this range are plotted as individual dots. Within each classification algorithm, paired Wilcoxon tests were performed to determine if accuracies were significantly different when trained on different feature types. P-values are denoted for the relationships indicated. B) Distributions of internal accuracies for 51 MCF7-trained landmark gene MIE classifiers are shown as box-and-whisker plots for each classification algorithm. Pairwise Wilcoxon tests were performed to compare the top three performing algorithms (SVM_P, SVM_L, and SVM_R), with p-values denoted for the relationships indicated. C) Scatter plots comparing internal accuracies across 6 classification algorithms for MCF7-trained landmark gene classifiers

