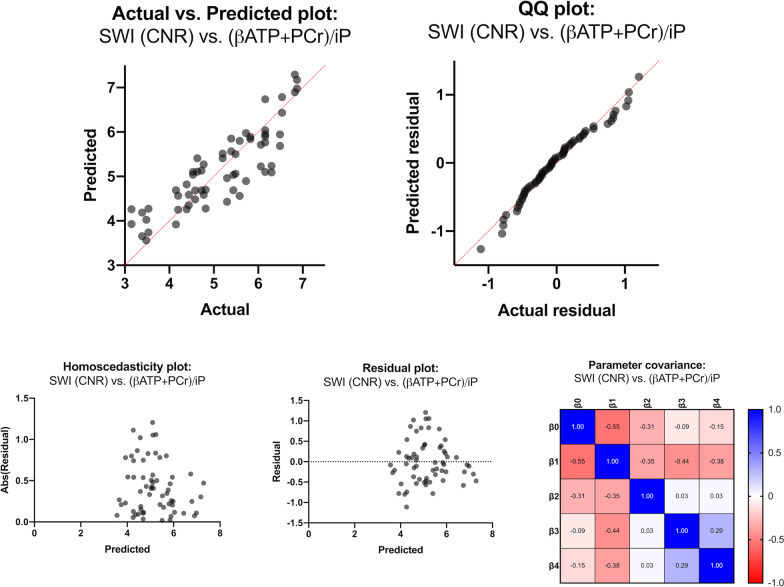
Fig. 3.
Graphical representation of the multiple linear regression model of (βATP + PCr)/iP vs. SWI CNR values. The validity of the respective multiple regression model is shown in the Actual vs. Predicted plot (the line of identity is highlighted in red). We demonstrated the fulfillment of necessary assumptions for multiple linear regression models by a QQ plot (normality of residuals), a homoscedasticity plot (evenness of residuals' variance), a residual plot (residuals are not themselves predictive), and a parameter covariance matrix (selected parameters are not concerningly intertwined). Abs(Residual) absolute value of residuals, ATP adenosine triphosphate, CNR contrast-to-noise ratio, iP inorganic phosphate, PCr phosphocreatinine, SWI susceptibility-weighted imaging

