
FIG. 1.
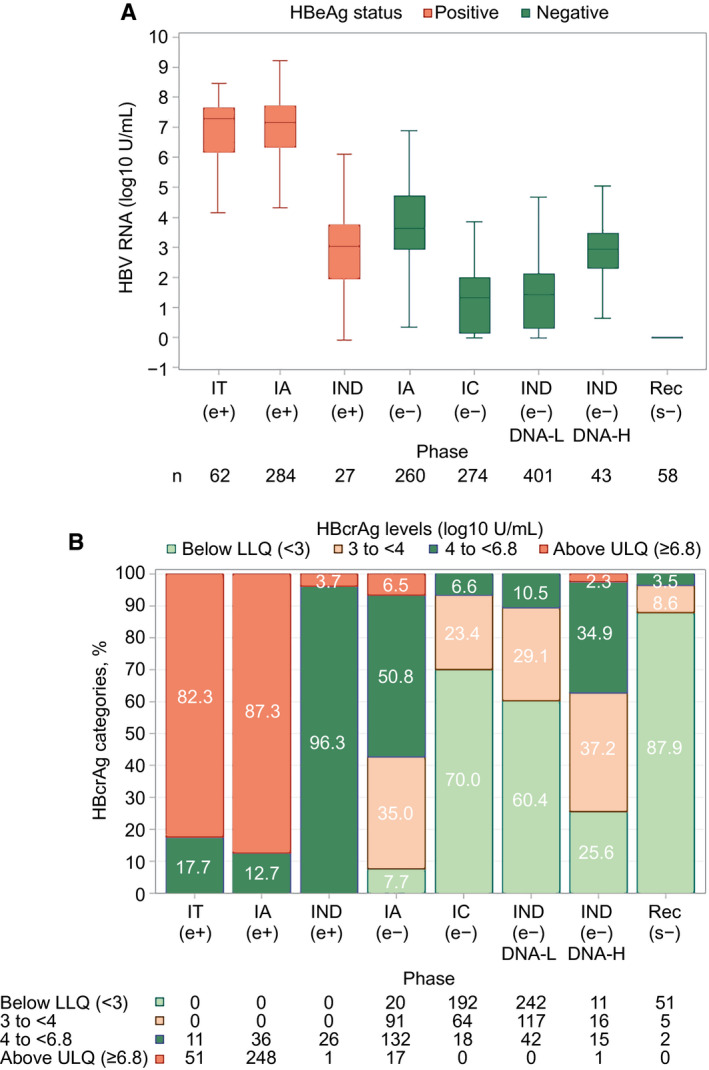
HBV RNA and HBcrAg categories by CHB phase. (A) HBV RNA by CHB phase. (B) HBcrAg categories by CHB phase. (A) HBeAg‐positive participants depicted by red boxes and HBeAg‐negative participants by blue boxes. In box‐whisker plots, upper and lower ends of the boxes = upper and lower quartiles, horizontal line = median, and upper and lower whiskers = highest and lowest observations. n = numbers of participants in each CHB phase. (B) Green bars = HBcrAg below lower limit of detection, brown bars = HBcrAg 3‐<4 U/L, blue bars = HBcrAg 4‐<6.8 U/L, and red bars = HBcrAg ≥6.8 U/L. Abbreviations: LLQ, lower limit of quantification; ULQ, upper limit of quantification.