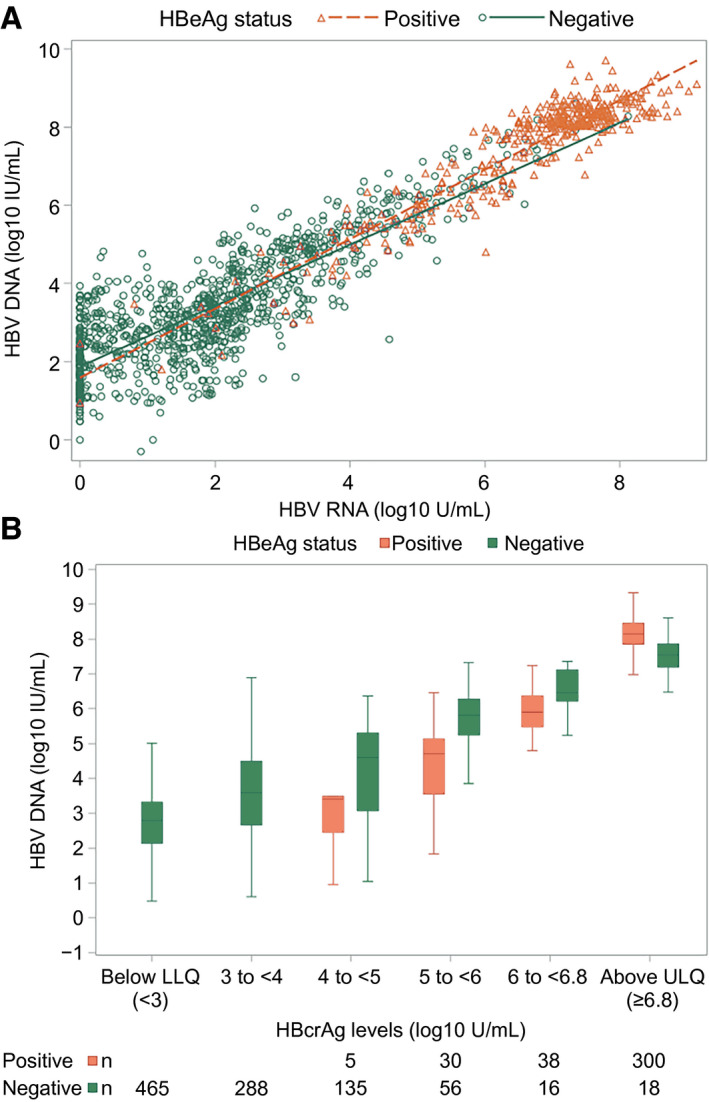
FIG. 2.

HBV DNA (log10 IU/mL) by HBV RNA (log10 U/mL) and HBcrAg (log10 U/mL) categories, respectively. (A) HBV DNA by RNA. HBV DNA by HBcrAg categories. (A) HBeAg‐positive participants represented by red triangles and HBeAg‐negative participants represented by blue circles. (B) HBeAg‐positive participants depicted by red boxes and HBeAg‐negative participants by blue boxes. In box‐whisker plots, upper and lower ends of the boxes = upper and lower quartiles, horizontal line = median, and upper and lower whiskers = highest and lowest observations. Abbreviations: LLQ, lower limit of quantification; ULQ, upper limit of quantification.
