Figure 4.

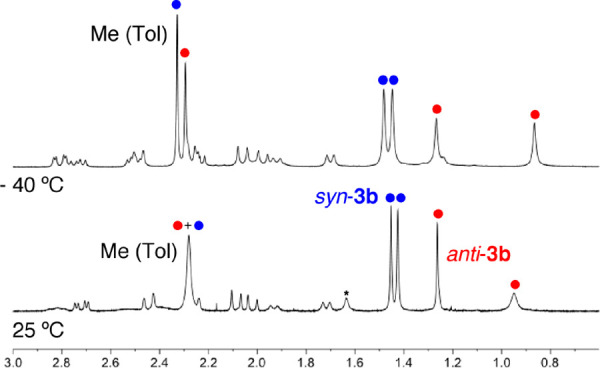
1H NMR spectra (0.6–3.0 ppm) of complex 3b (400 MHz) in CDCl3 at 25 °C (bottom) and −40 °C (top). The asterisk indicates the signal corresponding to H2O. The blue and red circles correspond to the syn and anti isomers, respectively.

1H NMR spectra (0.6–3.0 ppm) of complex 3b (400 MHz) in CDCl3 at 25 °C (bottom) and −40 °C (top). The asterisk indicates the signal corresponding to H2O. The blue and red circles correspond to the syn and anti isomers, respectively.