
Figure 2.
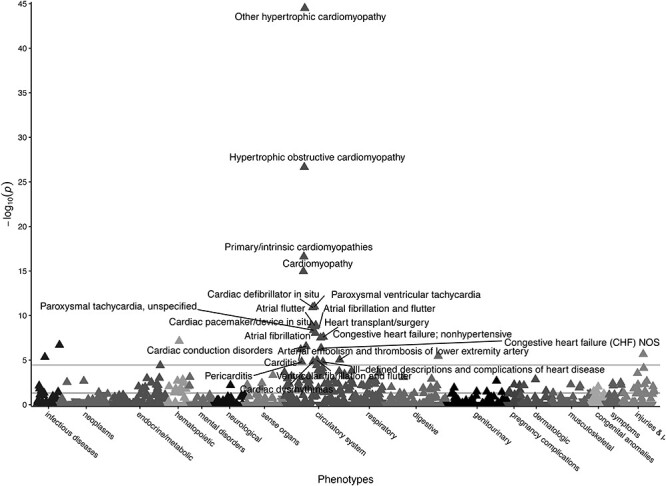
Gene burden PheWAS of pLOF and adjudicated pathogenic missense variants in MYBPC3. Gene burden PheWAS of pLOF variants (N = 45, Supplementary Material, Table S1) and adjudicated pathogenic missense variants from SHaRE (N = 22, Supplementary Material, Table S3) in MYBPC3. Phecodes are plotted along the x-axis to represent the phenome, and the association of the gene burden with each Phecode is plotted along the y-axis representing –log10(P-value). The directionality of each triangular point represents the direction of effect. The top horizontal line represents the Bonferroni-corrected significance threshold to adjust for multiple testing (P = 3.58E-05), and the bottom horizontal line represents a nominal significance threshold (P = 0.05).