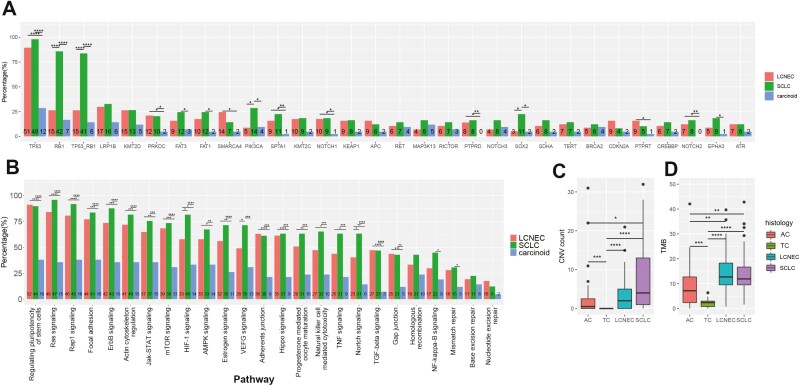
Figure 1.
The comparison of genomic features in different histological sub-cohorts. (A) gene mutated frequency; (B) pathway mutated frequency, only pathways with mutations >10 are listed and pathways including TP53 or RB1 are excluded; (C) copy number variation (CNV); (D) tumor mutational burden (TMB); LCNEC (n = 57), SCLC (n = 49), carcinoids (n = 36); (∗P < .05, ∗∗P < .01, ∗∗∗P < .001, ∗∗∗∗P < .0001).

