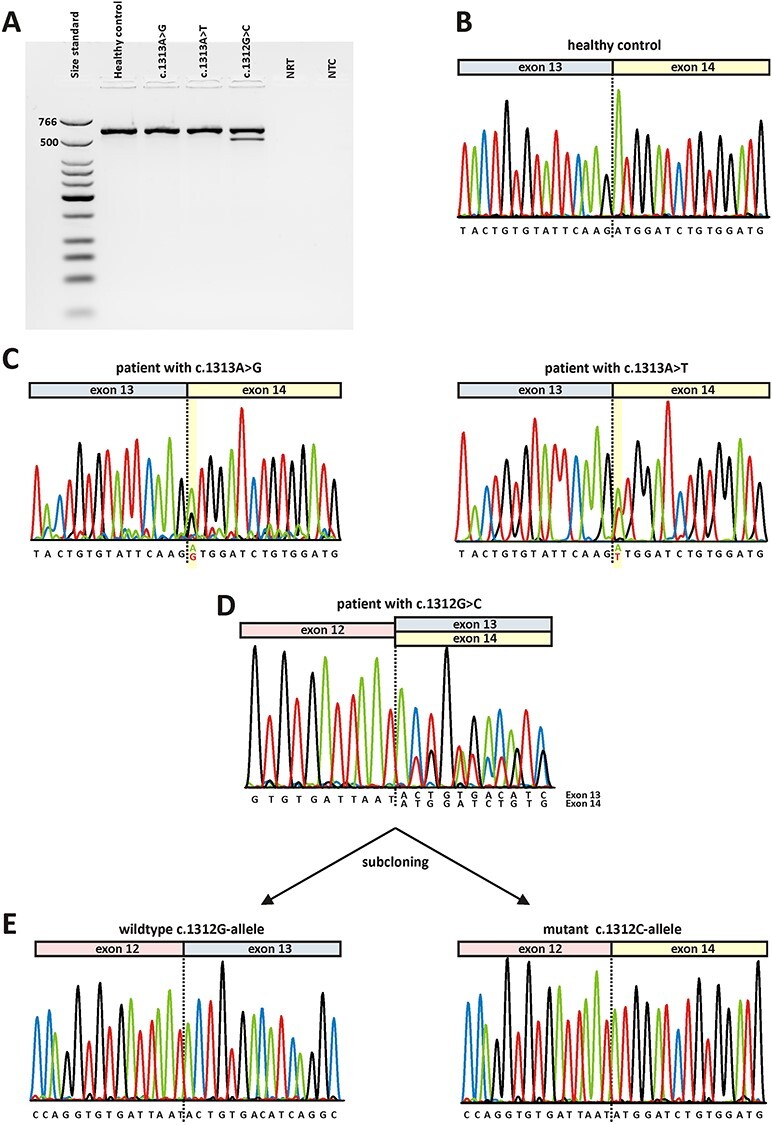
Figure 3.

Direct transcript analysis from blood samples. Following cDNA synthesis with random hexamers, RT-PCR was performed using primers located in OPA1 exon 11 and exon 17. A) Agarose gel electrophoresis. Lane 1: size standard (low molecular weight DNA ladder, NEB); lane 2: RT-PCR from a healthy control person; lane 3: RT-PCR from a patient heterozygous for c.1313A > G; lane 4: RT-PCR from a patient heterozygous for c.1313A > T; lane 5: RT-PCR from a patient heterozygous for c.1312G > C; lane 6: no reverse transcriptase control (NRT); lane 7: no template control (NTC). Expected sizes of RT-PCR amplified products were 599 bp in the event of normal splicing and 499 bp in the event of exon 13 skipping. B) Sequence electropherogram of healthy control person shows correct splicing of exon 13 to exon 14. C) Sequence electropherograms relating to variants c.1313A > G (left) and c.131A > T (right) show correct splicing of exon 13 to exon 14. Both alleles have been amplified from cDNA as can be seen from an overlay of the wildtype nucleotide and the respective mutant nucleotide at position c.1313 (highlighted in yellow). D) Sequence analysis of RT-PCR products from a patient harboring the c.1312G > C variant. The overlay of sequence traces after exon 12 indicates amplification from both the correct transcript and a transcript lacking exon 13. E) Subcloned RT-PCR products confirm that the wildtype c.1312G-allele generated a correctly spliced transcript (left) while the transcript derived from the mutant c.1312C-allele lacks exon 13 (right).
