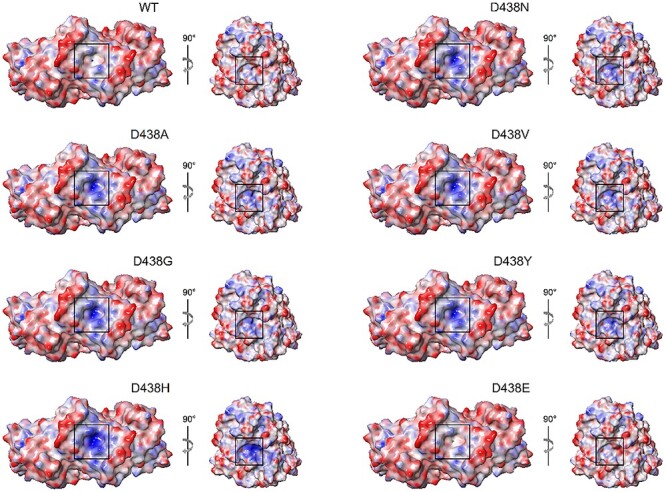
Figure 5.

Electrostatic potential mapped on the molecular surface of WT OPA1-MGD dimer (left) and monomer (right) and D438 variants. The molecular surface of the protomers is colored in a blue-to-red scale from −12.5 to 12.5 kT/e. The right side of each panel shows a single protomer rotated clockwise along the z-axis, the surface of residue 438 is framed in black.
