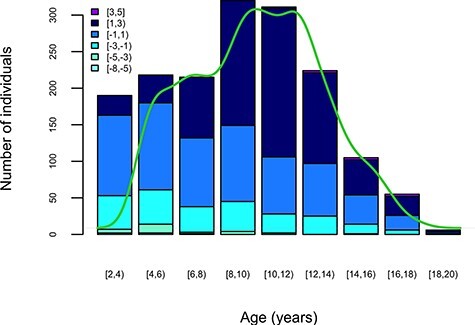
Figure 5.

BMI SDS values of the Bambino Gesù study sample within their age distribution. Colours represent BMI SDS groups as displayed in the figure insert. The bars represent subject counts within each BMI SDS group by the age group (x-axis). The green line shows the age density of the study sample.
