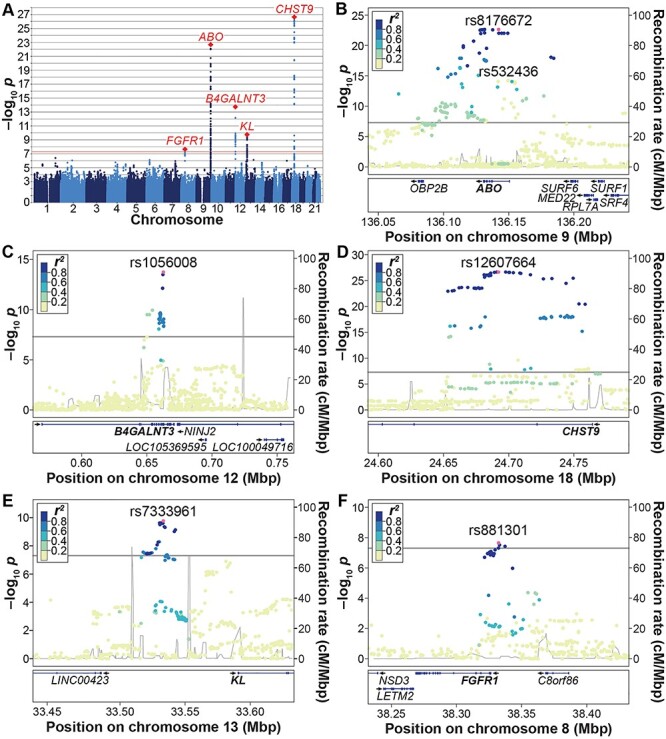
Figure 1.

Results from the α-Klotho GWAS meta-analysis. (A) Manhattan plot. The x-axis indicates the chromosomal position of each SNP, whereas the y-axis denotes the evidence of association shown as −log10(P-value). The red line indicates genome-wide significance of association (P = 5 × 10⁻⁸). (B–F) Locus-specific Manhattan plots of the genome-wide significant loci at (B) the ABO locus, (C) the B4GALNT3 locus, (D) the CHST9 locus, (E) the KL locus and (F) the FGFR1 locus. The x-axis indicates the physical position of each SNP on the chromosome, the y-axis denotes the evidence of association as the −log10(P-value). The linkage disequilibrium (LD) r2 between SNPs, based on the 1000 Genomes EUR superpopulation, is shown in colour.
