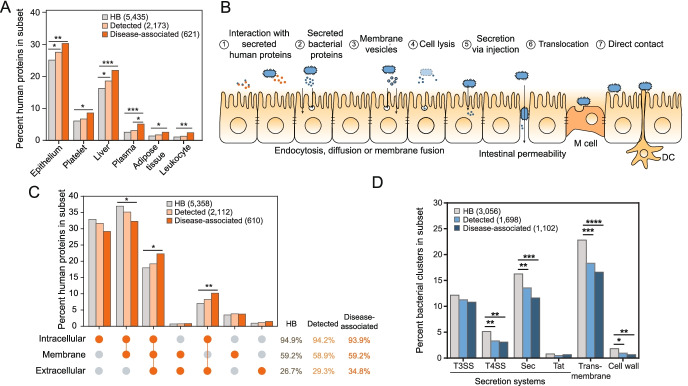
Fig. 2.
Bacterial proteins gain access to human proteins through a variety of mechanisms. A Proportions of human proteins in the HBNet, Detected and Disease-associated subsets are plotted according to their enrichments in tissues and fluids, as annotated using DAVID. Only those with significant enrichment between any two subsets are shown. p values for enrichments are depicted by * p<0.05; ** p<0.01; *** p<0.001; **** p<0.0001 (EASE Score provided by DAVID, a modified Fisher’s exact P value; FDR-adjusted). Total numbers of each set are noted in the legend. B A schematic depicting potential opportunities for bacterial proteins to access human proteins. Interactions may involve (1) secreted human proteins, (2) bacterial proteins secreted into the extracellular space; (3) membrane vesicles that are endocytosed or can fuse with human cell membranes; (4) bacterial cellular lysate; (5) proteins injected into human cells by T3SS, T4SS, and T6SS, (6) cells and their products that translocate as a result of barrier dysfunction or “leaky gut”, and/or (7) direct contact with M cells, dendritic cells (DC), or epithelial cells. C Proportions of human proteins in the HBNet, Detected and Disease-associated subsets, are plotted according to their subcellular locations, as annotated using Gene Ontology Cellular Component, is depicted. p values for enrichments are depicted by: * p<0.05; ** p<0.01; *** p<0.001; **** p<0.0001 (chi-square test). Total percentages for these subsets are listed at right, along with p-values. Total numbers of each set are noted in the legend. D Proportions of bacterial gene clusters in the HBNet, Detected and Disease-associated subsets are plotted according to their transmembrane and secretion predictions, annotated using TMHMM, EffectiveDB, and SignalP. p values for enrichments are depicted by * p<0.05; ** p<0.01; *** p<0.001; **** p<0.0001 (chi-square test). Total numbers of each set are noted in the legend

