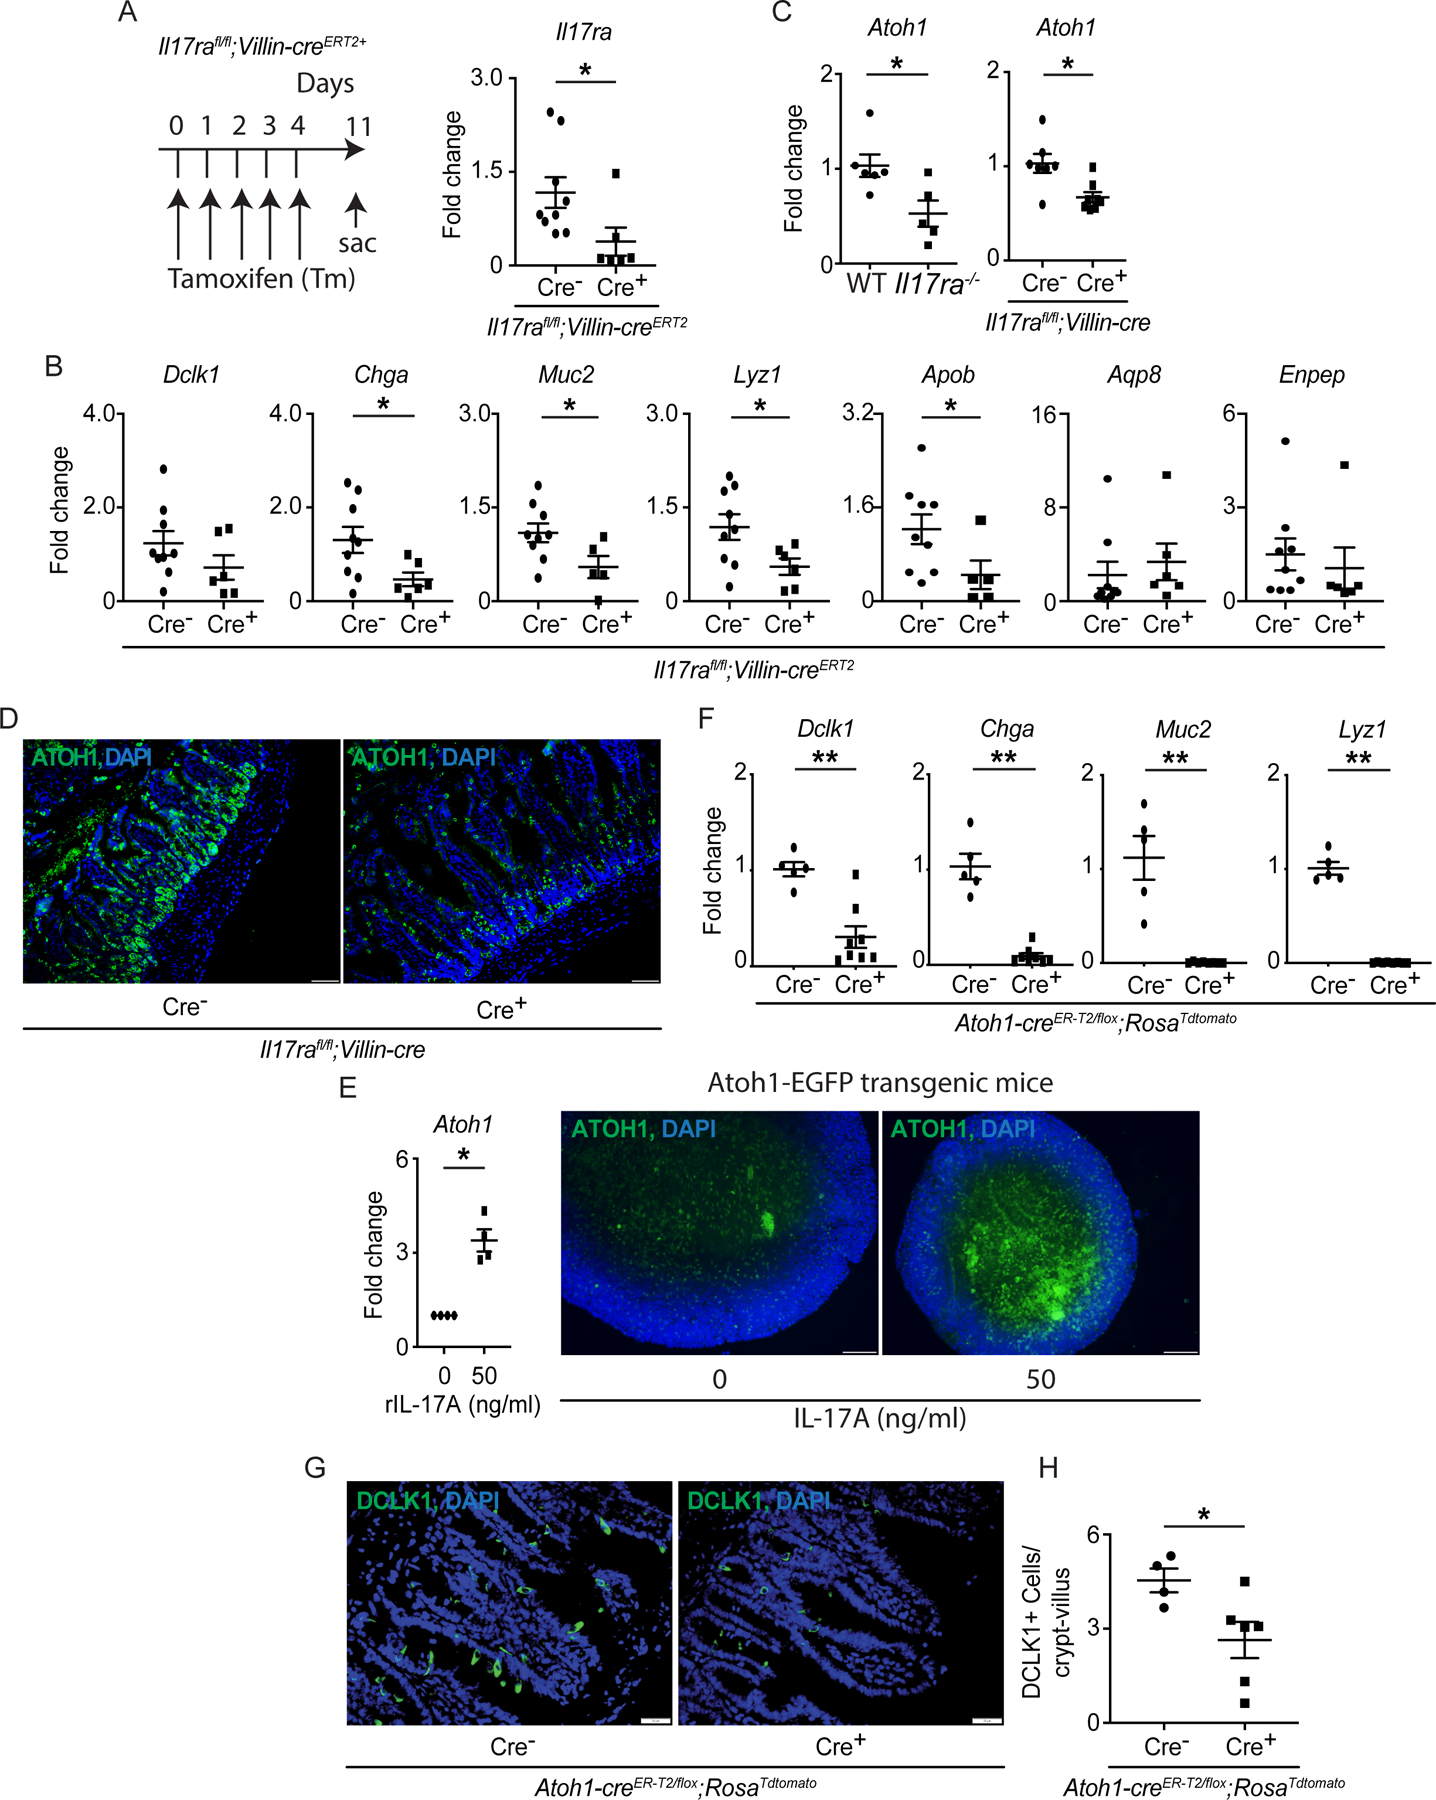
Figure 2. Mice deficient in IL-17RA display ATOH1 defects.

A-B) Il17rafl/fl;Villin-creERT2 mice were injected with tamoxifen for 5 continuous days. The schematic diagram shows the strategy of tamoxifen administration (A, left panel). The RNA was extracted from the terminal ileum on day 11 and RT-PCR confirmed the depletion of Il17ra post tamoxifen injection (A, right panel). The expression of Dclk1, Chga, Muc2, Lyz1, Apob, Aqp8 and Enpep was analyzed by RT-PCR (B). C-D) RNA was extracted from the terminal ileum of naïve WT, Il17ra−/− and Il17rafl/fl;Villin-cre mice. The expression of Atoh1 was analyzed by RT-PCR (C). The terminal ileum of naïve Il17rafl/fl;Villin-cre mice was stained with anti-ATOH1 (D). E) Crypts isolated from the ileum of ATOH1-EGFP mice were used for organoid culture under recombinant IL-17A (50 ng/ml) treatment. RT-PCR was utilized to analyze the expression of Atoh1 (left panel) and immunofluorescence showed the ATOH1 expression in the vehicle or recombinant IL-17A-treated organoids (right panel). F-H) The RNA was extracted from the terminal ileum of Atoh1-creER-T2/flox;RosaTdtomato mice at one week post the last tamoxifen injection. RT-PCR data depict the expression of Dclk1, Chga, Muc2 and Lyz1 (F). The ileum was stained with anti-DCLK1 (G) and the number of DCLK1+ cells was plotted (H). Figures 2A (right panel), 2B, 2C (right panel), 2F and 2H were generated from 2–3 independent experiments. Figure 2D, 2E (right panel) and 2G are the representative images of at least 4 mice in each group. Data are presented as mean ± SEM in all graphs. Scale bars in relevant figures equal 20 μm (2D), 50 μm (2E) and 20 μm (2G). *P ≤ 0.05; **P ≤ 0.01 (Mann-Whitney test, two-tailed in A-C, E, F and H). See also Figure S2.
