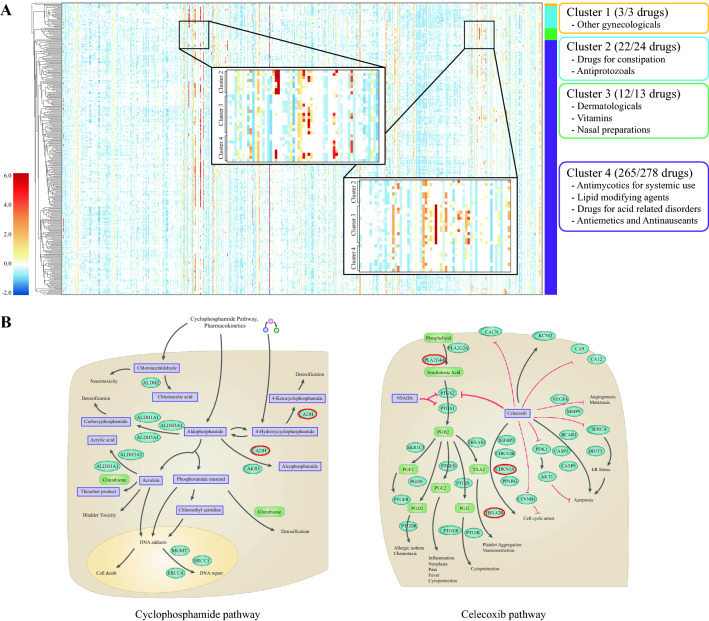
Fig. 5.
Analysis of drug dynamic features. A Visualization of changes in compound treated gene expressions depending on co-administered drugs. The heatmap shows the changed features of one drug affected by each paired drug. Hierarchical clustering was done considering the correlation of features, and drug categories of each cluster were labeled. B Pathway information of cyclophosphamide and celecoxib. Among highly attended genes, ADH5 in chyclophosphamide pathway and PLA2G4A, TBXA2R, and CDKN1A genes in celecoxib pathway were detected as highlighted in red

