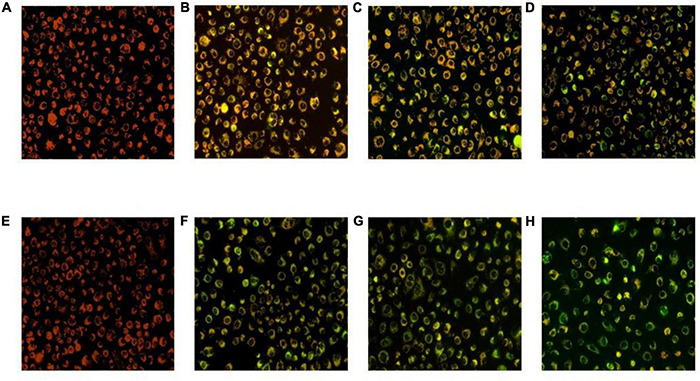
FIGURE 5.

Mitochondrial membrane potential of the HT-29 cells treated with L. acidophilus KLDS1.0901. L. acidophilus KLDS1.0901 treated with HT-29 cells of different MOI (10, 50, and 100) for 24 h (A–D) and 48 h (E–H). A fluorescence microscope was used to photograph images (20×).
