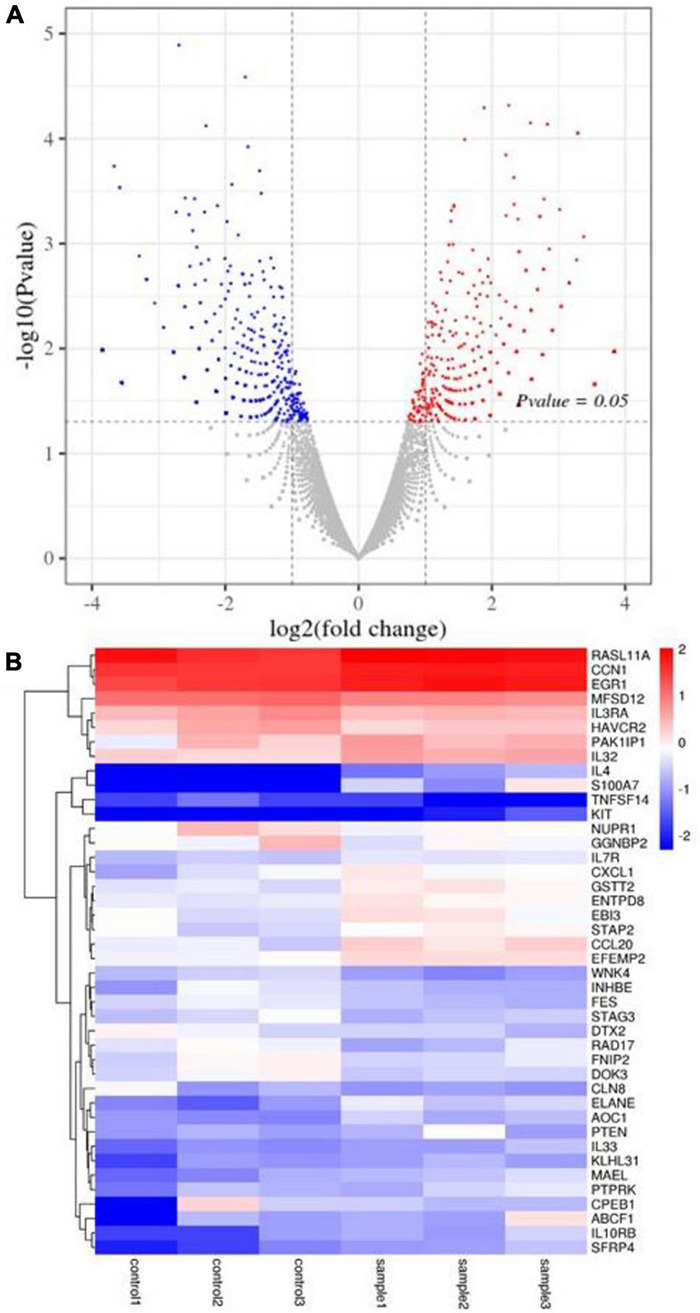
FIGURE 6.

DEG analysis of HT-29 cells treated with L. acidophilus (n = 3). (A) The volcano plot of a differential gene. (B) Clustering heatmap of differentially expressed gene expression. Controls 1, 2, and 3 were nontreated with L. acidophilus in HT-29 cells. Samples 1, 2, and 3 were treated with L. acidophilus of MOI 100 for 48 h in HT-29 cells. The red dots in the differentially expressed gene volcano map represent up-regulated, differentially expressed genes; blue dots represent down-regulated, differentially expressed genes, and gray dots represent non-differentially expressed genes. The heatmap expresses cancer-related genes, where red represents genes with high log2 (FPKM/average FPKM) expression, and blue represents low expression.
