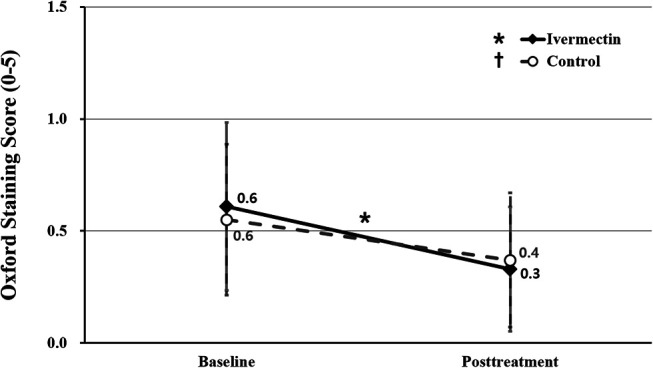
FIGURE 3.

Comparison of Oxford staining scores between ivermectin and control groups. The asterisk indicates statistically significant changes in the Oxford staining score in the ivermectin group. The asterisk indicates P < 0.05 per repeated-measures ANOVA with Tukey's HSD post hoc test. ANOVA, analysis of variance; HSD, honestly significant difference.
