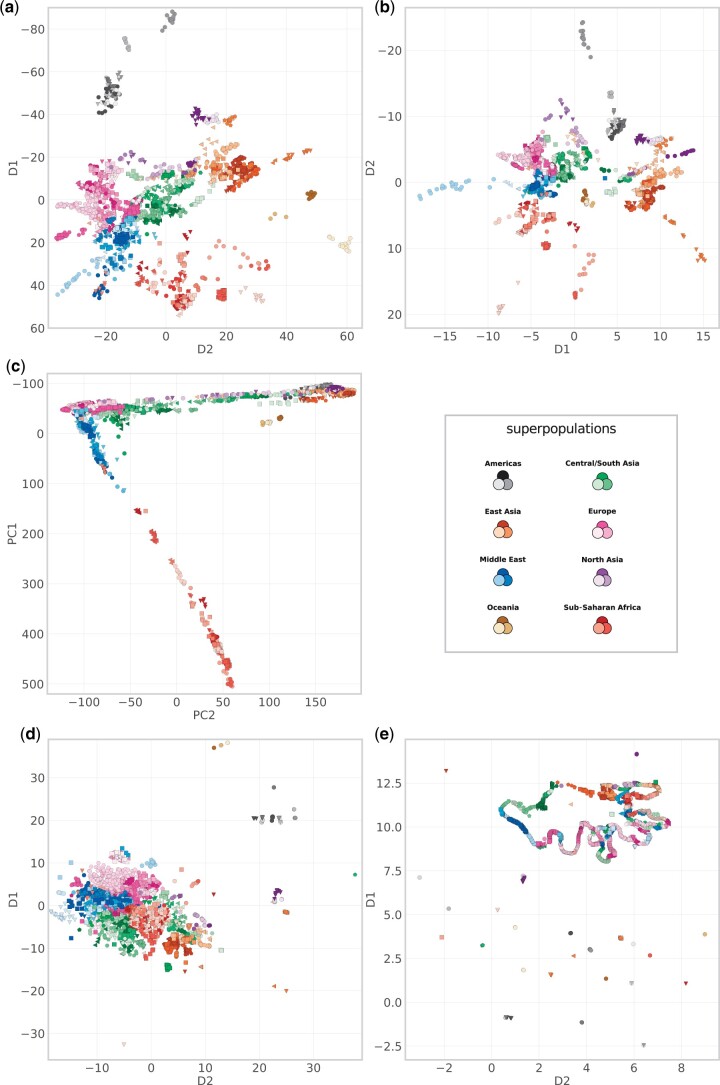
Fig. 3.
Dimensionality reduction results for GCAE a), popvae b), PCA c), t-SNE d) and UMAP e) on the Human Origins data set. In order to get a more direct correspondence to the cardinal geographical directions, the D1/PC1 axis has been inverted for GCAE and PCA, and for popvae, the D2 dimension is displayed on the y-axis, also inverted. Legend shows superpopulation colors, full legend with all populations in Fig. 1.

