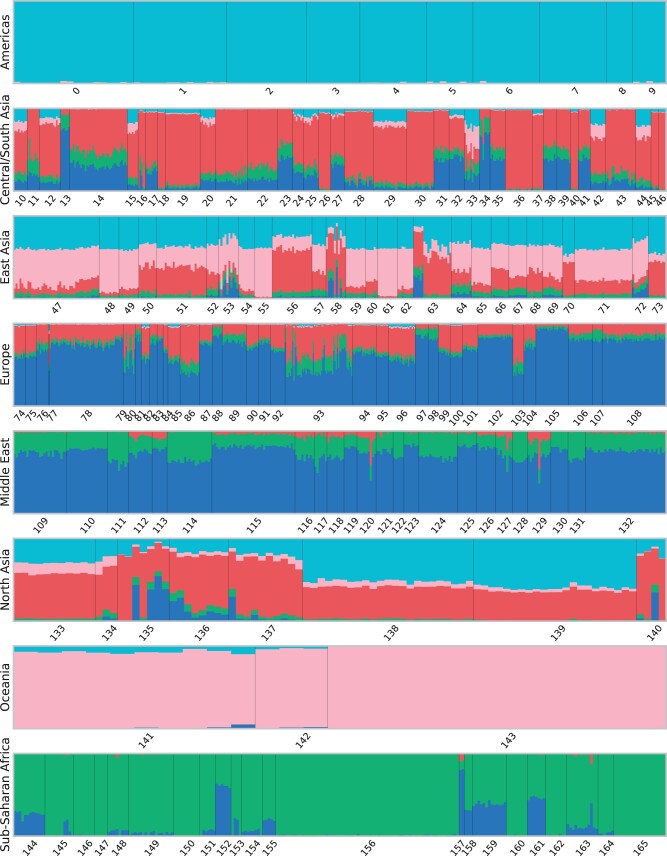
Fig. 6.
Genetic clustering results with k = 5 clusters using GCAE. Each bar represents a sample from the Human Origins data set, with colors indicating the proportional assignment into k clusters for that sample. Samples are ordered by population and superpopulation, with numbering according to the legend in Fig. 1.

