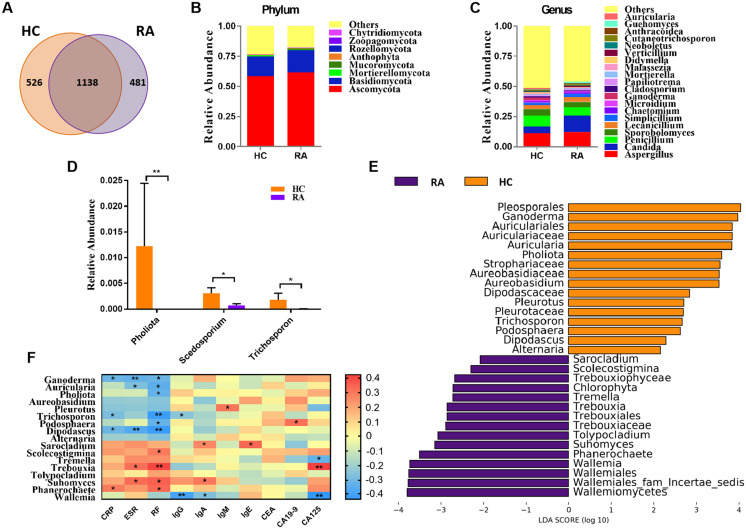
Figure 1. Comparison of mycobiota between RA patients and healthy controls.
(A) Venn diagram of shared and independent fungal OTUs between the two groups; Fungal community bar plot at the phylum (B) and genus (C) levels; (D) the analysis of species difference at genus level with the values evaluated as mean ± SEM; (E) LEfSe analysis of mycobiota between the RA patients and healthy controls; (F) Heatmap of Spearman correlations between fungal taxa and serological features of RA. The color red represents the highest score value (the highest correlation), while blue marks the lowest score value (the lowest correlation). *P < 0.05, **P < 0.01.

