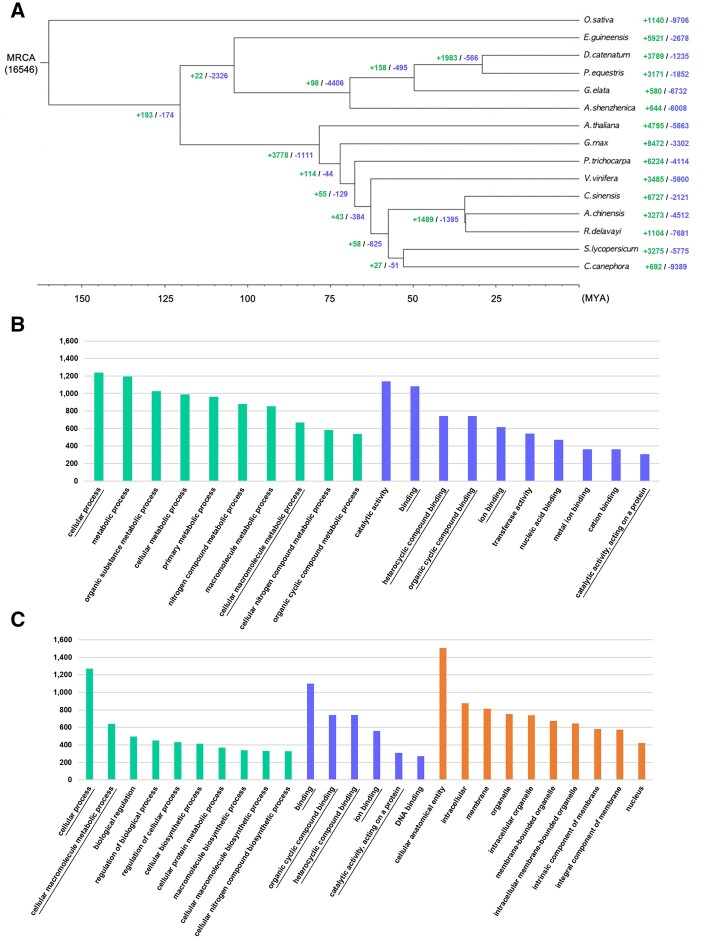
Figure 5.
(A) Phylogenetic analysis of G. elata among 15 plants and gene family gain-and-loss analysis including the number of gained gene families (+) and lost gene families (−). (B) The number of genes in the top 10 GO terms of expanded gene families (Supplementary Table S7) and (C) contracted gene families (Supplementary Table S8) in the G. elata genome. The green, blue, and orange colored bars represent the three major GO categories, biological process, MF, and CE, respectively. The overlapping terms in both expanded and contracted gene families are underlined.

