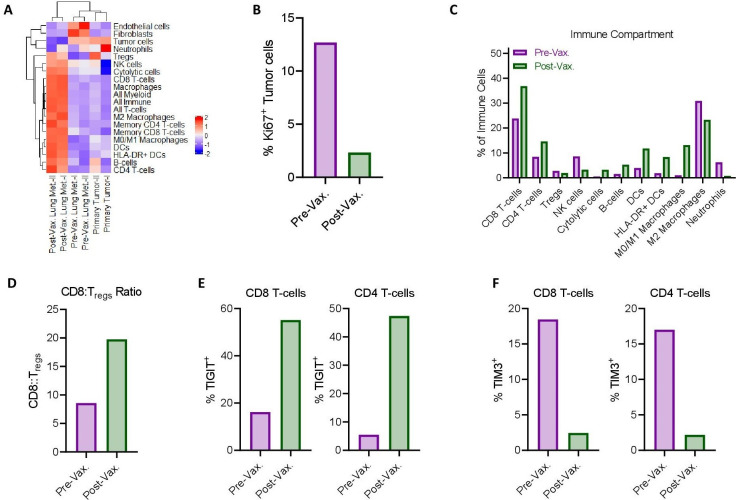
Figure 2.
Imaging mass cytometry indicates robust anti-tumor immune response following COVID-19 vaccination. (A) Clustergram of imaging mass cytometry quantification in biopsy specimens from primary tumor and prevaccination (Pre-Vax.), and postvaccination (Post-Vax.) lung metastases (Lung Met.). I and II indicate specimens from different regions taken at the same time. Color axis represents each phenotype subpopulation frequency (z-normalized density [cells/mm2] values), red for high frequency and blue for low frequency or absence (−2); (B) Percentage of proliferative (Ki67+) tumor cells (pan-CK+ and/or p63+) in Pre-Vax. and Post-Vax. lung metastasis specimens. (C) Percentage of indicated immune cell populations as percentage of total immune cells in Pre-Vax. and Post-Vax. lung metastasis specimens. (D–F) Comparison of Pre-Vax. and Post-Vax. lung metastasis specimens for (D) ratio of CD8+ T cells to regulatory T cells (Tregs), (E) percentages of CD8+ T cells and CD4+ T cells positive for TIGIT, and (F) percentages of CD8+ T cells and CD4+ T cells positive for TIM3. +, positive.

