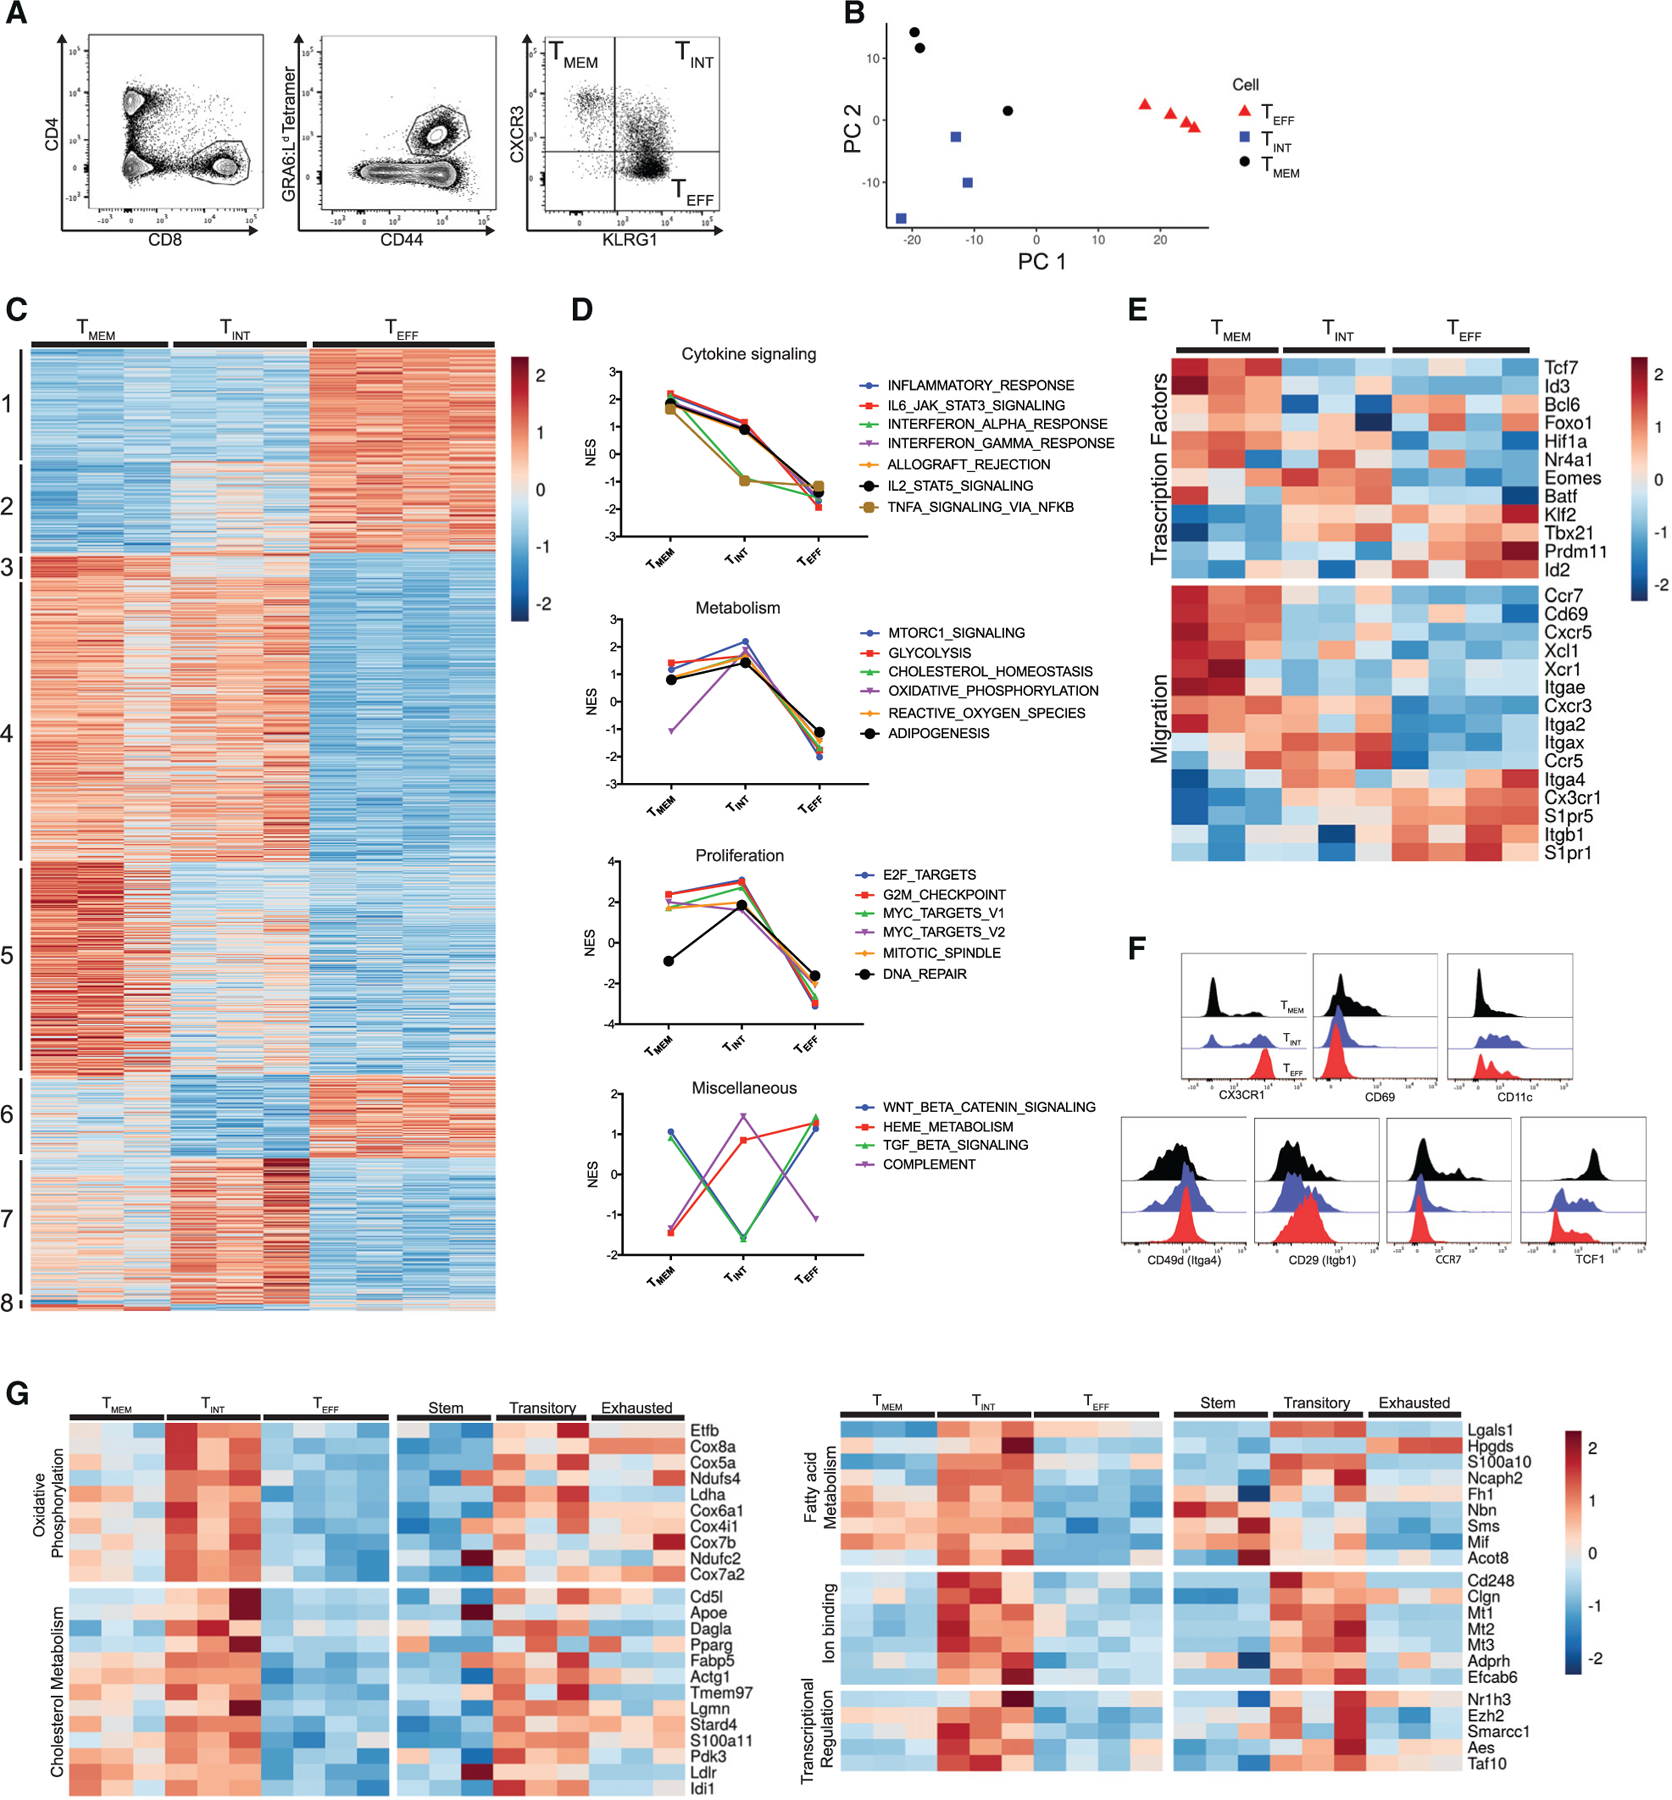
Figure 1. TMEM, TINT, and TEFF cells express distinct transcriptional profiles.

(A) Gating strategy for cell sorting prior to RNA-seq.
(B) The first two principal components of the sorted GRA6-specific populations.
(C) Heatmap displaying the normalized expression for all genes differentially expressed in pairwise comparison (TMEM versus TINT, TINT versus TEFF, and TMEM versus TEFF cells). Genes were ordered and grouped based on the results of differential expression tests. Each column represents independent biological replicates (n = 3 mice for TMEM and TINT cells, n = 4 mice for TEFF cells).
(D) Selected results of GSEA with Hallmark gene sets using one-versus-all comparisons (TMEM versus TINT and TEFF cells, TINT versus TMEM and TEFF cells, TMEM versus TEFF and TINT cells). The full set of enriched Hallmark gene sets is displayed in Figure S1. Plots show normalized enrichment score (NES).
(E) Heatmap displaying the normalized expression of selected differentially expressed genes related to the indicated function.
(F) Representative flow cytometry histograms showing protein staining on TMEM, TINT, and TEFF cells.
(G) Heatmap displaying the expression of selected genes from group 7, arranged by the indicated functional categories.
Values are from sorted GRA6-specific subsets (current study) or published transcriptional data on stem, transitory, and exhausted cells during LCMV infection (Hudson et al., 2019).
