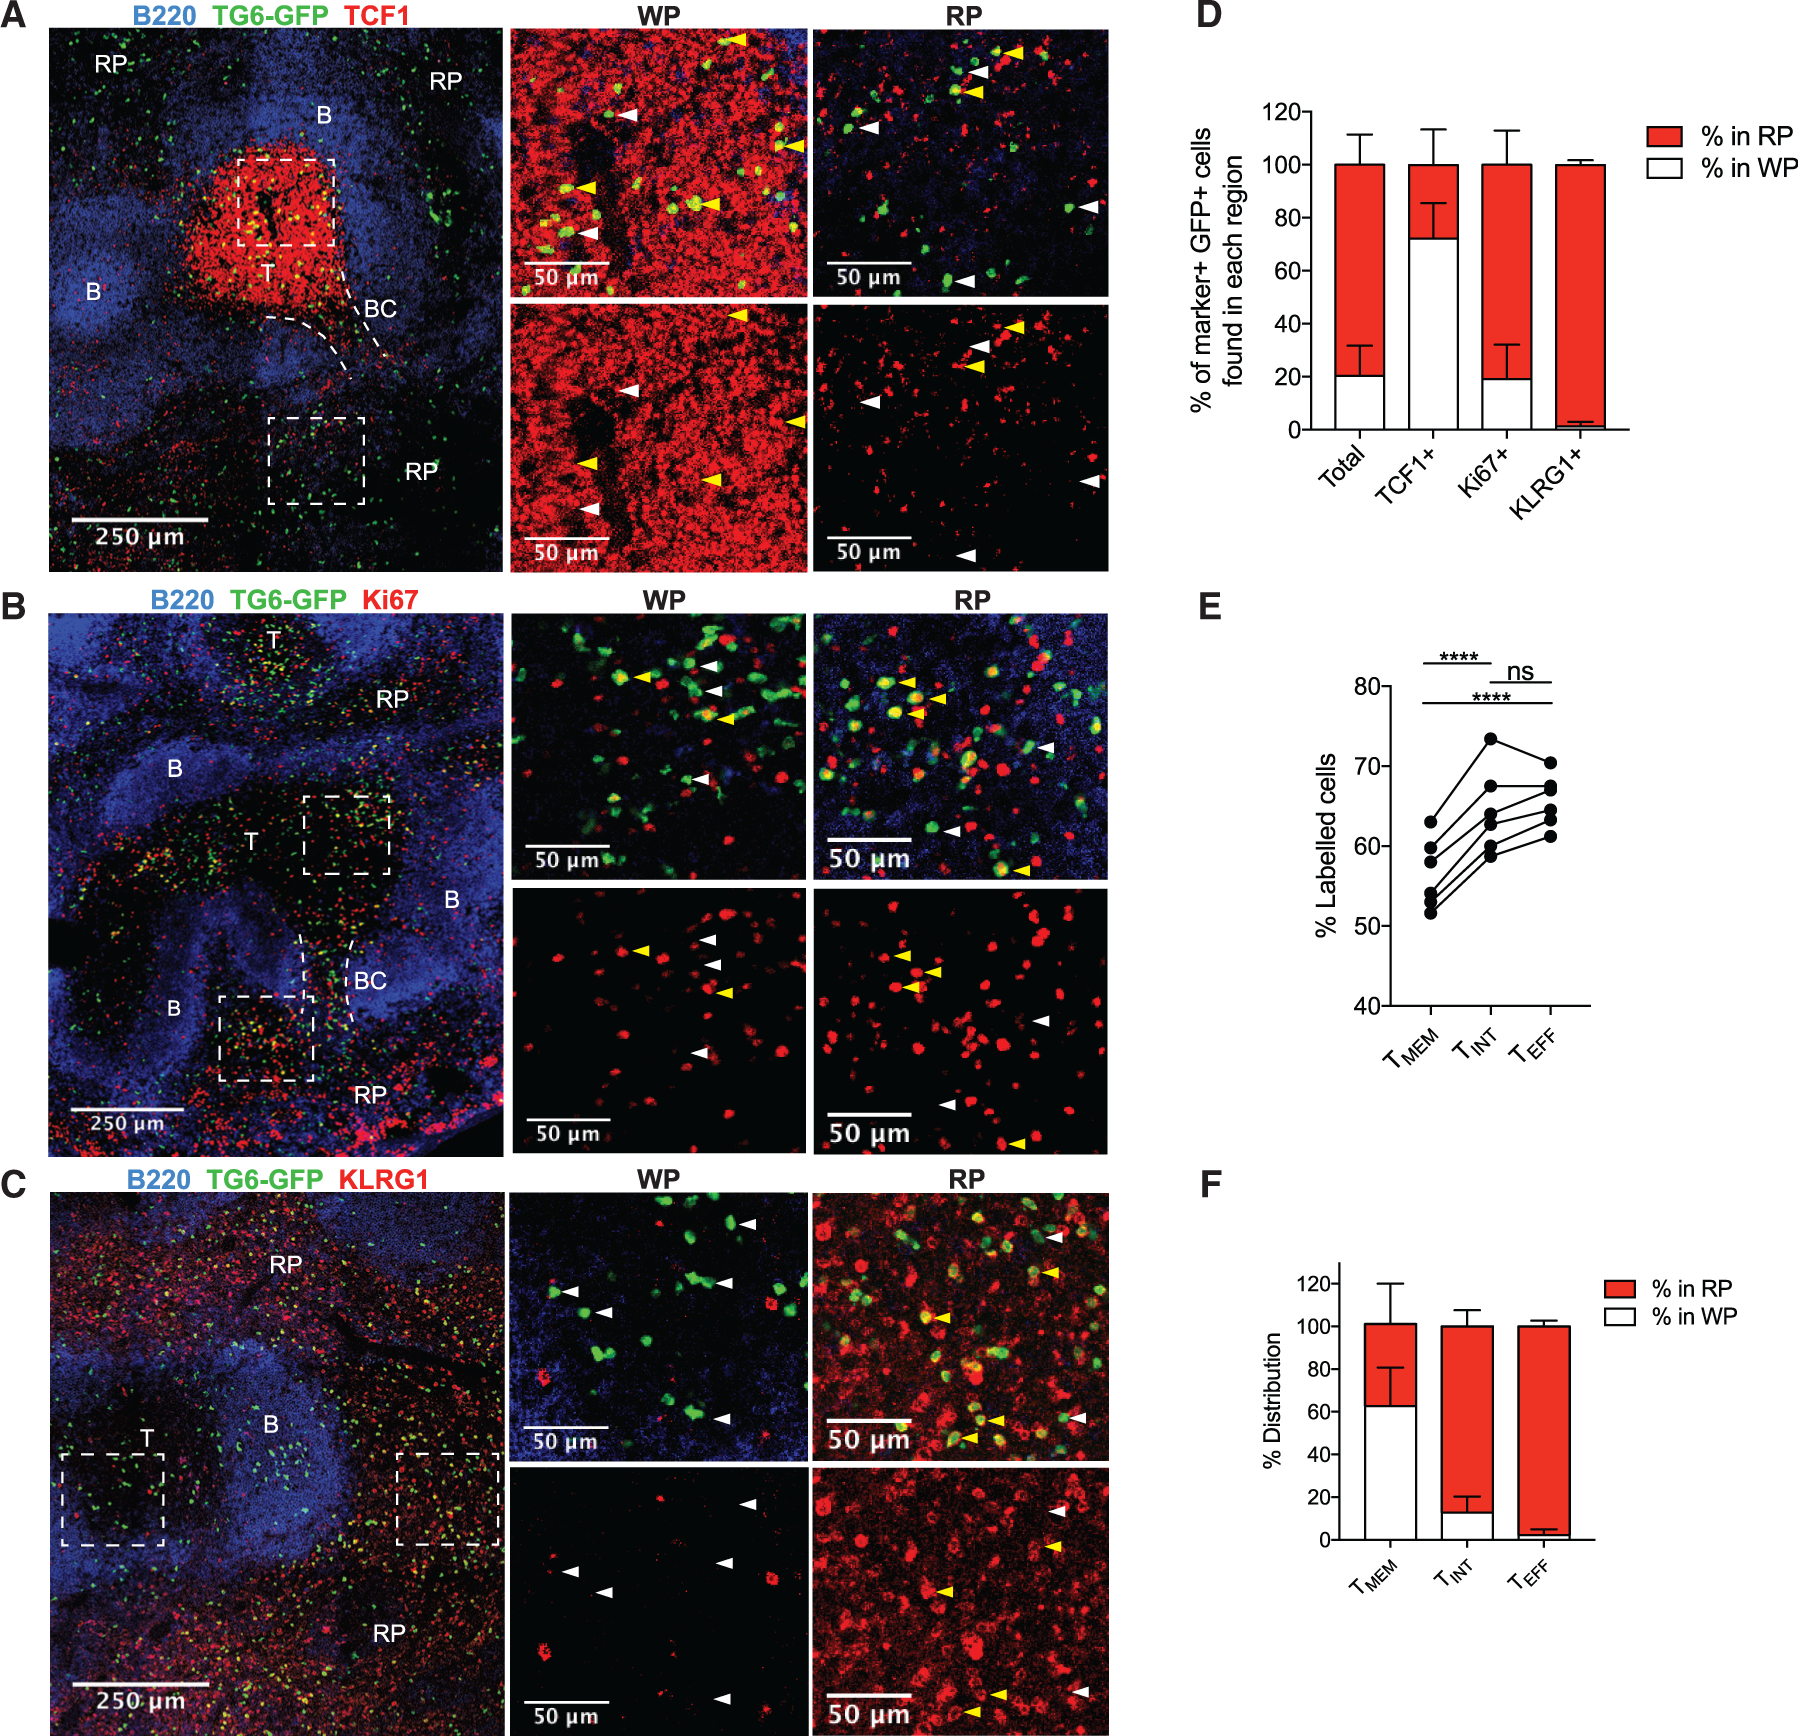
Figure 2. TMEM, TINT, and TEFF cells reside in distinct areas of the spleen.

(A–C) TG6-GFP chimeric mice infected with T. gondii and their spleens were analyzed by confocal microscopy after 6 weeks. Sections were stained with antibodies against TCF1 (A), Ki67 (B), and KLRG1 (C) to identify the location of TMEM, T, and TINT/TEFF TG6-GFP cells, respectively. B220 staining was used to identify B cell zones (B) and T cell zones (T) to map the white pulp (WP) and red pulp (RP) regions. In some images, bridging channels (BCs) are marked with dotted lines. Dashed rectangles indicate the area in the magnified regions on the right. Examples of cells staining positively with the indicated marker are highlighted with yellow arrows and negative examples with white arrows.
(D) Data summarizing the location of TG6-GFP cells that stained positively for each protein.
(E) Data showing the proportion of each GRA6-specific population labeled after i.v. anti-CD8 antibody injection.
(F) Summary data showing the location of TMEM, TINT, and TEFF cells in the spleen after adoptive transfer.
Images in (A)–(C) and data in (D) are representative of images taken from three or more separate mice. Data in (E) are taken from two separate infections and are representative of data from three separate experiments. Data in (F) are summarized from multiple recipient mice across three infections (TMEM cells, n = 3; TINT cells, n = 3; TEFF cells, n = 4).
