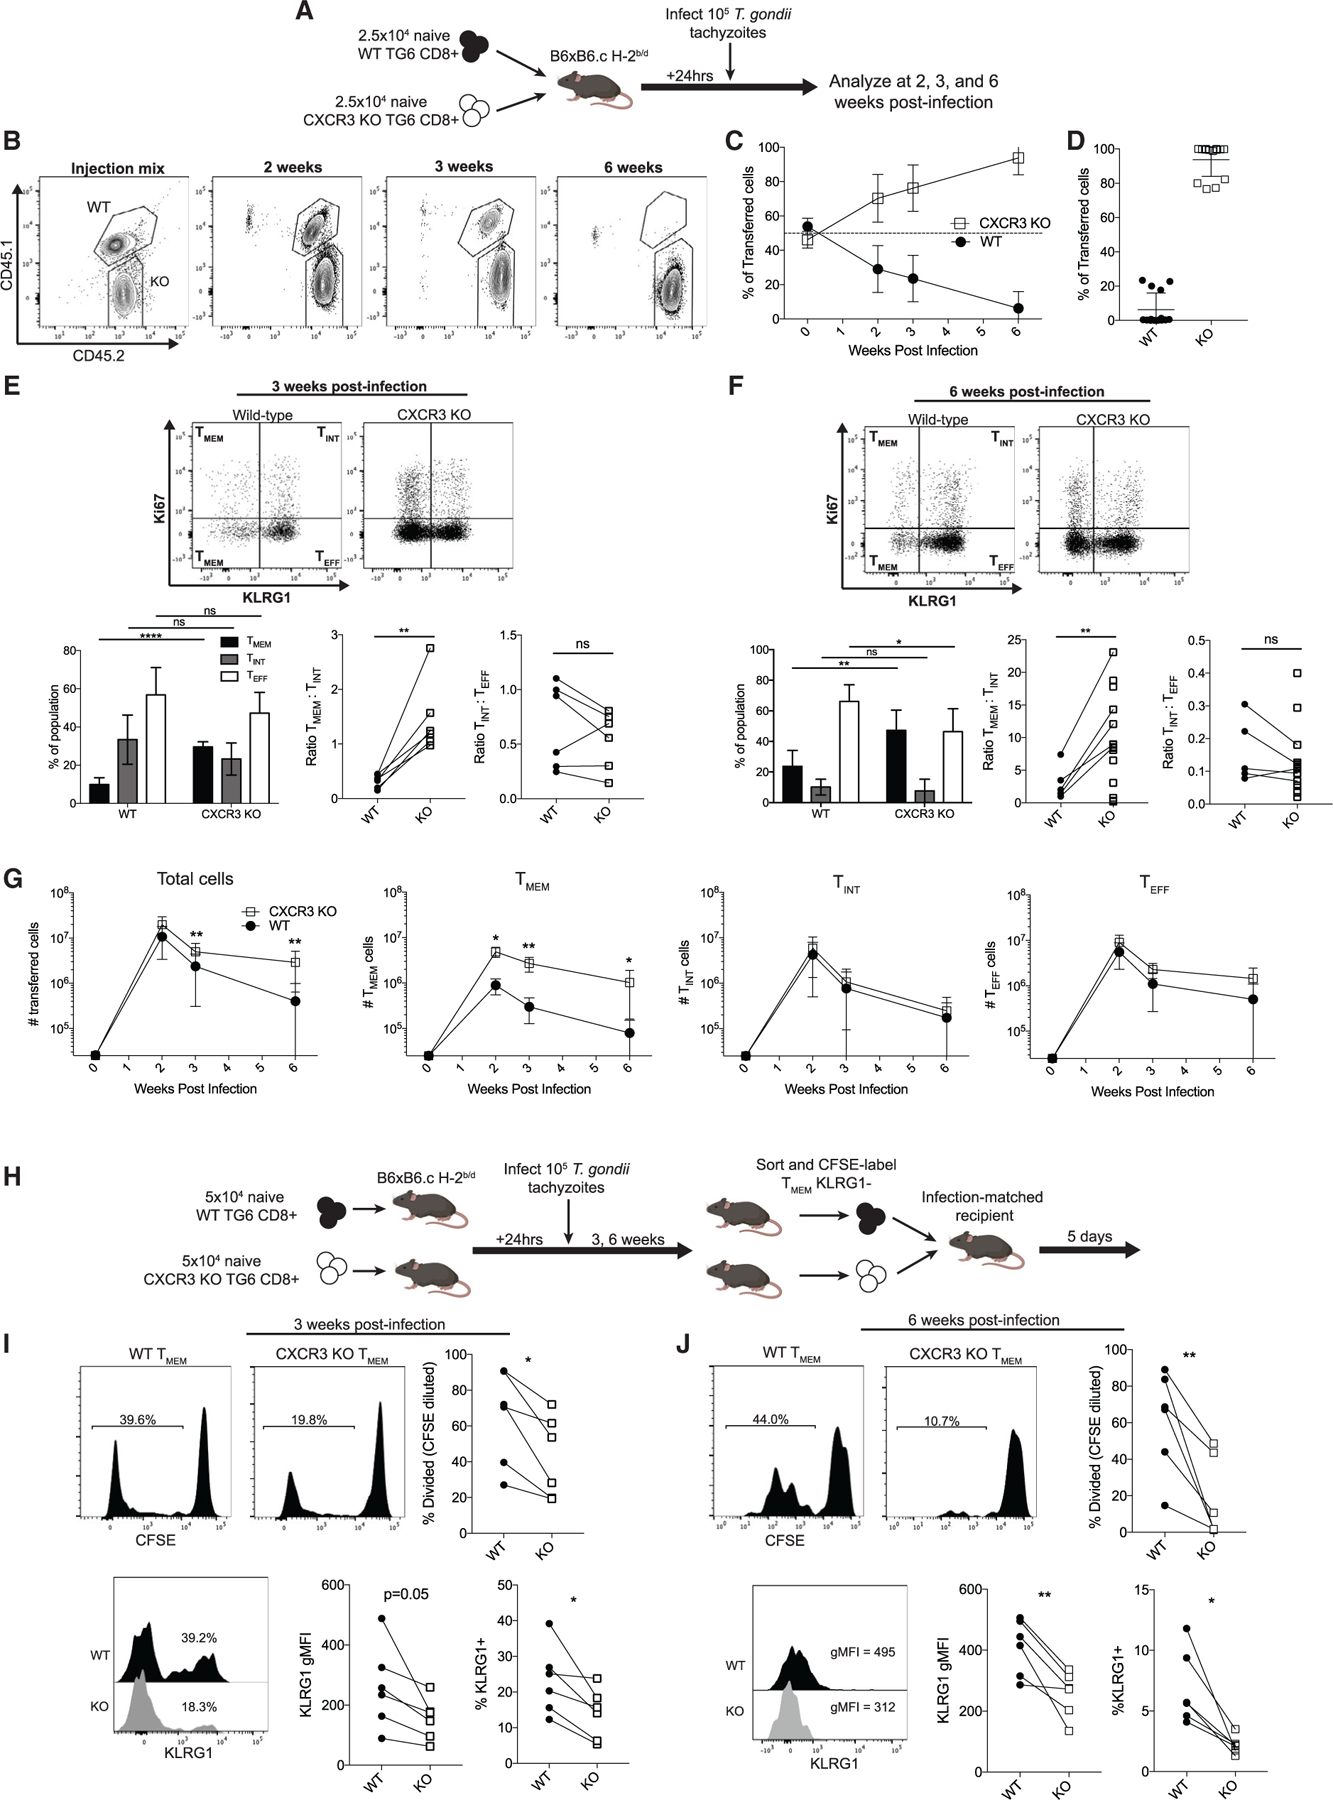
Figure 3. CXCR3-deficient CD8+ T cells develop an inflated TMEM cell pool.

(A) Experimental design.
(B) Representative flow cytometry plots of gated GRA6 tetramer+ CD8+ splenocytes at the indicated time points.
(C) Summary data showing the proportion of the transferred cells belonging to the WT or CXCR3 KO population.
(D) Individual data points for the time point 6 weeks after infection in (C).
(E and F) The differentiation profile of WT and CXCR3 KO TG6 cells 3 weeks (E) or 6 weeks (F) after infection. TMEM, TINT, and TEFF cell subsets were identified using Ki67 and KLRG1 staining. Bar graphs display the proportion of the transferred population belonging to each subset. Adjacent plots display the ratios of TMEM:TINT and TINT:TEFF cells in the WT and KO populations. Lines connect populations from the same mouse.
(G) Absolute numbers of cells belonging to each population.
(H) Experimental design.
(I and J) Representative flow plots and summary data for CFSE dilution and KLRG1 expression within the population of transferred WT and KO TMEM cells 3 weeks (I) and 6 weeks (J) after infection.
Data in (A)–(G) are combined from three independent experiments. Data in (H)–(J) are combined from two independent experiments.
