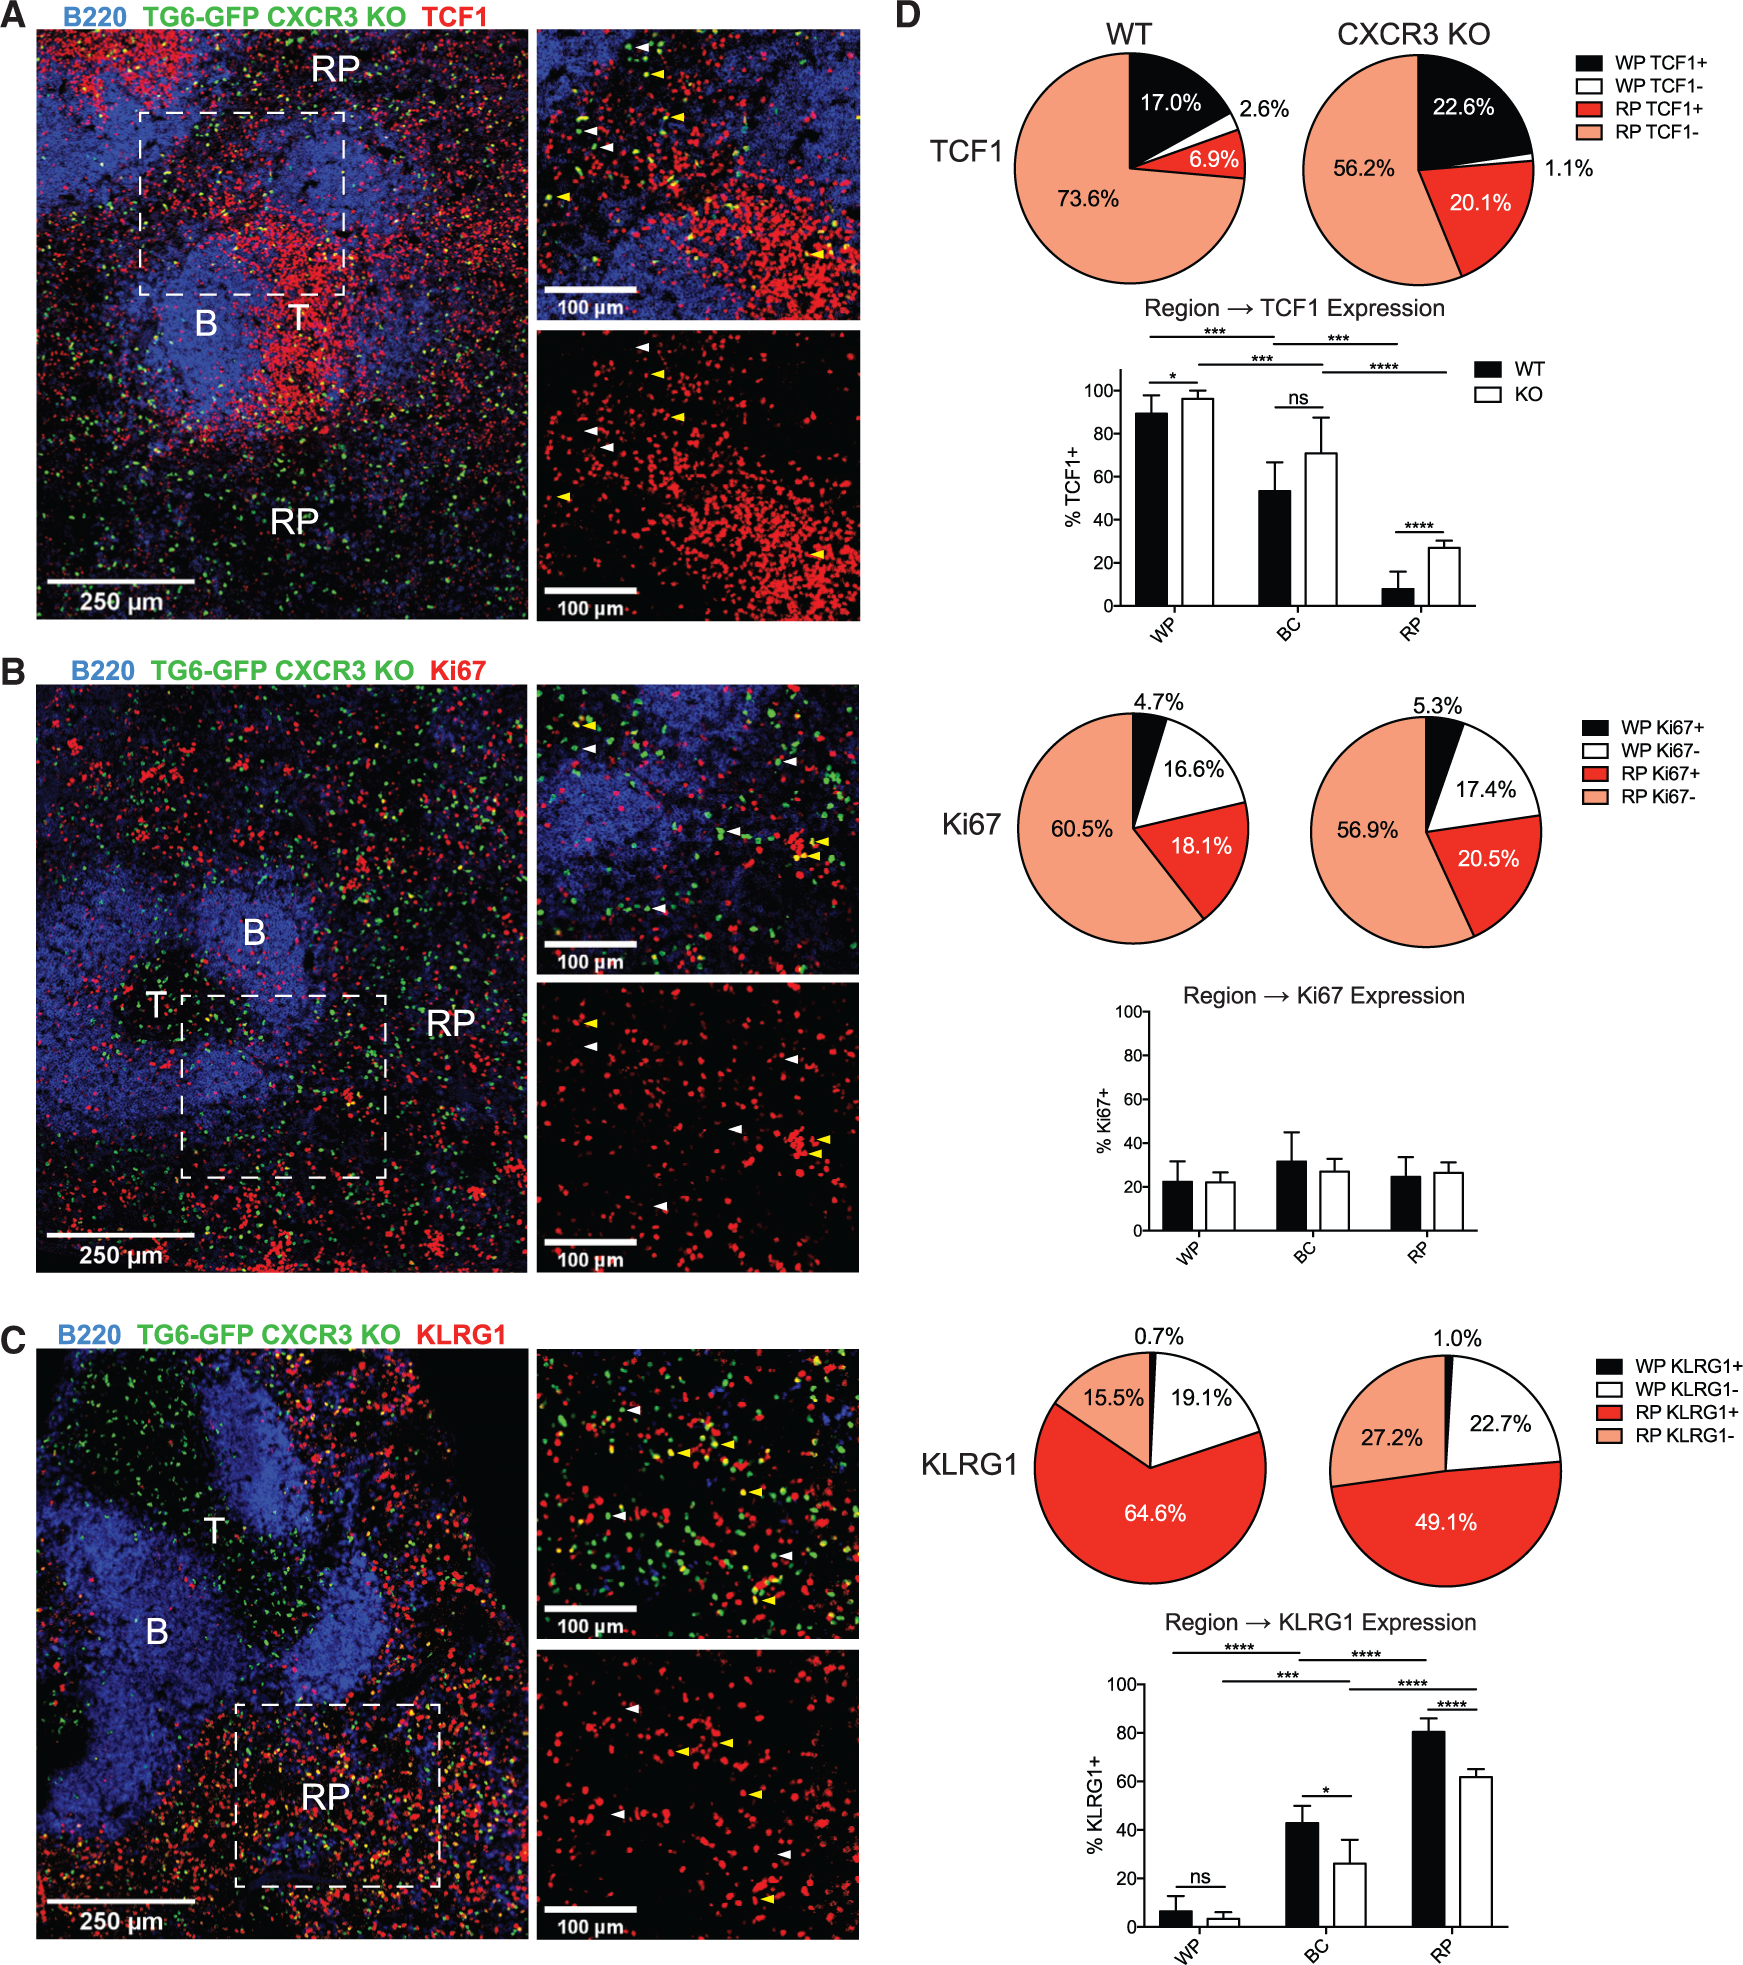
Figure 4. CXCR3-deficient CD8+ T cells retain a memory phenotype in the RP.

(A–C) CXCR3 KO TG6-GFP neonatal chimeras were infected with T. gondii and analyzed by confocal microscopy after 6 weeks. Sections were stained with antibodies against TCF1 (A), Ki67 (B), and KLRG1 (C). B220 staining was used to identify B cell zones (B) to map the T cell zone (T) and RP regions. Yellow arrows highlight examples of cells staining positively for the specified marker; white arrows highlight examples of negative staining.
(D) Summary data showing the proportion of GFP cells found in the WP or RP that are identified as positive or negative for expression of the indicated marker. Bar graphs display the proportion of WT or CXCR3 KO GFP cells expressing the protein of interest (TCF1, Ki67, or KLRG1) within the WP, BC, or RP.
Data for WT cells are combined from at least three mice across two different experiments, and data for KO cells are combined from four mice taken across two experiments.
