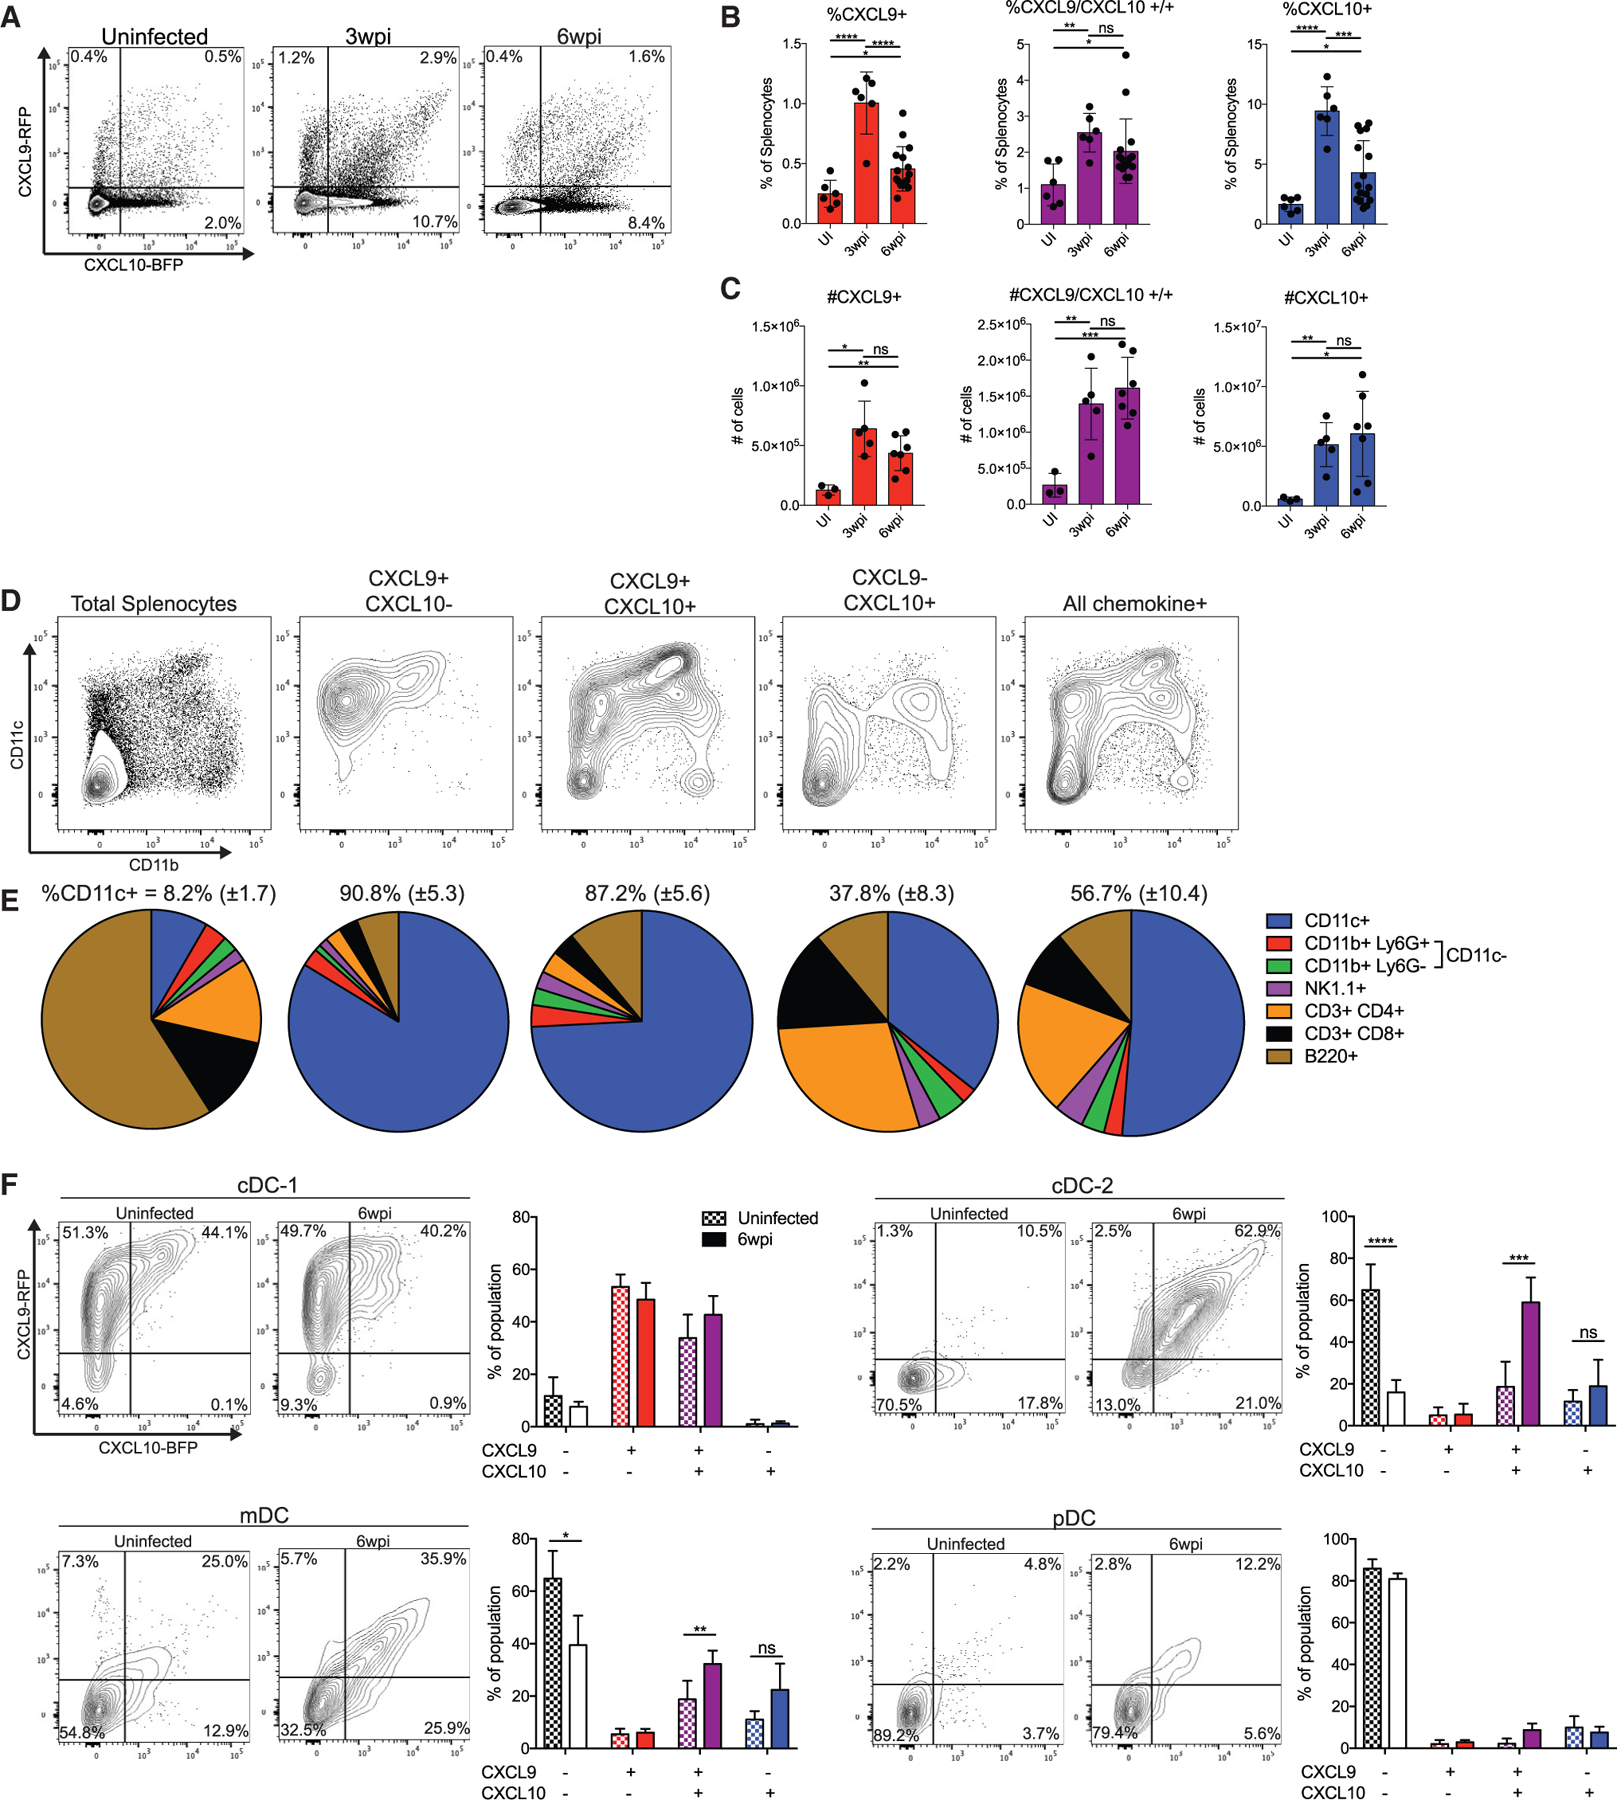
Figure 5. DCs are a significant source of CXCR3 ligands during chronic infection.

(A) Representative flow cytometry plots of chemokine expression in REX3 spleens before infection, 3 weeks after infection, and 6 weeks after infection.
(B and C) Summary data of the percentages (B) and absolute numbers (C) of chemokine-producing splenocytes during infection.
(D and E) Splenocytes from REX3 mice were stained with the indicated surface markers. Cells were then gated on chemokine expression, and the phenotype of different chemokine-expressing subsets was measured. Shown are (D) representative plots of CD11c × CD11b staining and (E) summary data. The mean and standard deviation of the percent of CD11c+ cells in each population is displayed above each chart.
(F) Subsets of DCs were identified (Figure S6), and their chemokine expression was analyzed in uninfected mice and 6 weeks after infection.
Data in (A)–(E) are pooled from three separate experiments. Data in (F) are combined from two separate experiments (n = 3 mice for uninfected, n = 8 mice for 6 weeks post infection).
