
Table 3.
The prevalence of ED in patients with OSA of different types of clinical data.
| Types of Clinical Data | Grouping | OSA with ED | OSA Without ED | P | OR (95%CI) | OR (95%CI) |
|---|---|---|---|---|---|---|
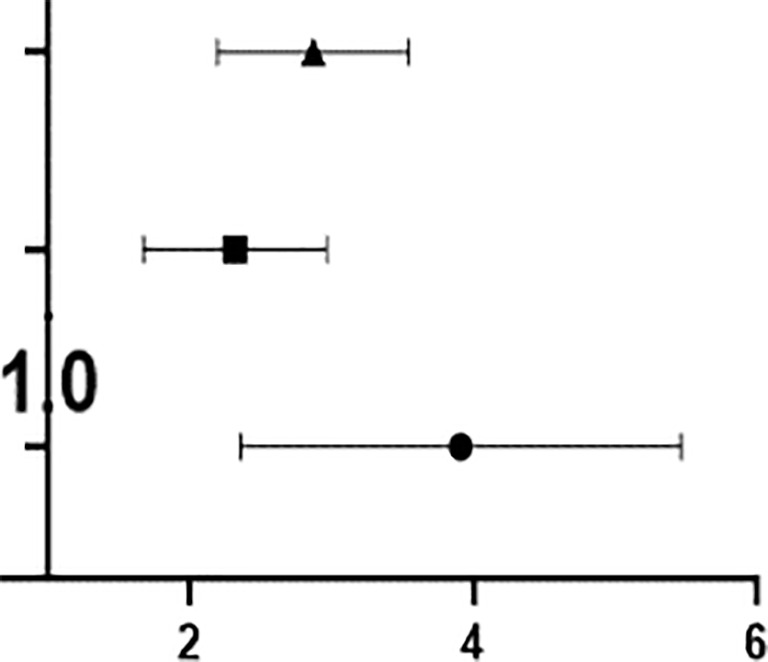
| Different severity groups | Non-OSA subjects | 0 | 11 | – | – | – |
| OSA patients | 80 | 44 | <0.001 | 2.818 (2.223-3.573) |
|
|
| Mild to moderate OSA | 34 | 27 | 0.001 | 2.259 (1.705-2.994) | ||
| Severe OSA | 46 | 17 | <0.001 | 3.706 (2.469-5.563) | ||
| Different age groups | Control | 0 | 11 | – | – | |
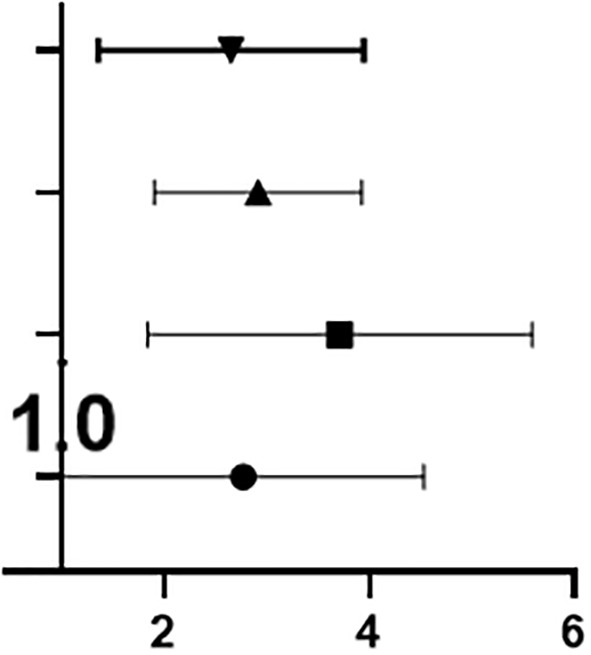
| 18~30 | 13 | 9 | 0.001 | 2.444 (1.479-4.039) |
|
|
| 31~40 | 36 | 20 | <0.001 | 2.800 (1.970-3.979) | ||
| 41~50 | 24 | 10 | <0.001 | 3.400 (2.020-5.723) | ||
| 51~60 | 7 | 5 | 0.002 | 2.400 (1.229-4.688) | ||
| Different BMI groups | Control | 0 | 11 | – | – | – |
| Normal (18.5~24) | 8 | 8 | 0.005 | 2.000( 1.225-3.265) |

|
|
| Overweight (24~28) | 25 | 17 | <0.001 | 2.471 (1.712-3.565) | ||
| Obese (>28) | 47 | 19 | <0.001 | 3.474 (2.377-5.077) |