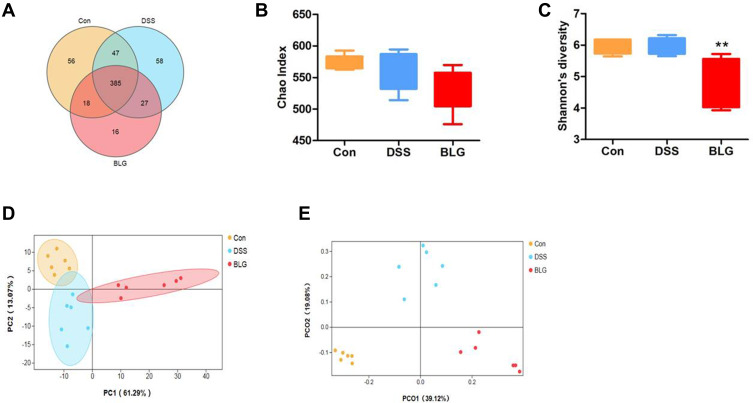
Figure 3.
BLG changed gut microbiota diversity of DSS-induced colitis mice. (A) Venn diagram for OTUs, (B) Chao1 index, (C) Shannon’s richness index, (D) score plot for principal component analysis (PCA) of OTUs, (E) score plot for principal coordinate analysis (PCoA) of OTUs. Data are expressed as the mean ± SEM (n = 6). **p < 0.01 vs DSS group.

