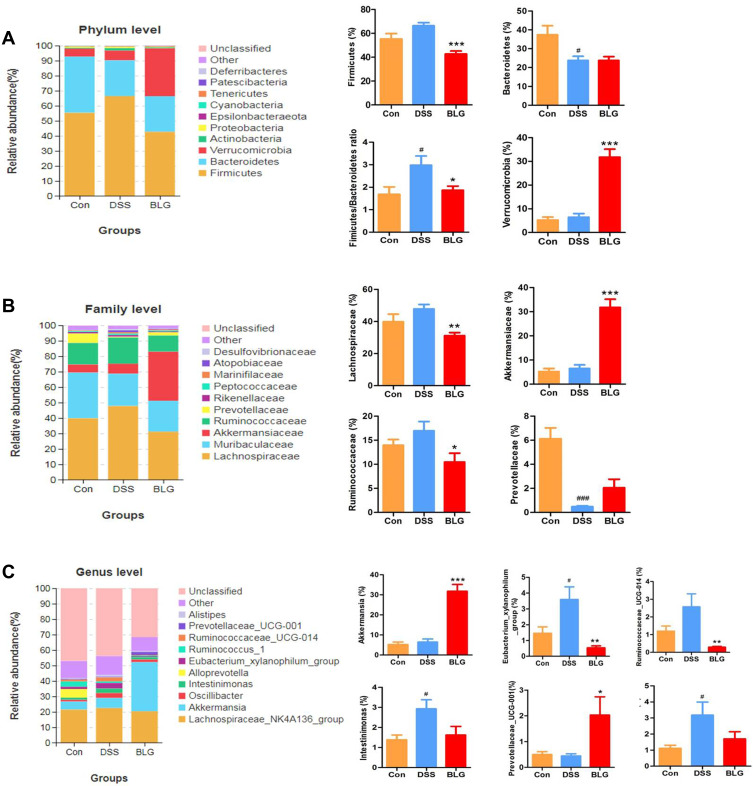
Figure 4.
BLG altered gut microbiota abundance of DSS-induced colitis mice. (A) the abundance of gut microbiota at the phylum level; (B) the abundance of gut microbiota at the family level; (C) the abundance of gut microbiota at the genus level. Data are expressed as the mean ± SEM (n = 6). #p < 0.05 or ###p < 0.001 vs control (Con) group; *p < 0.05 or **p < 0.01 or ***p < 0.001 vs DSS group.

