FIGURE 1.
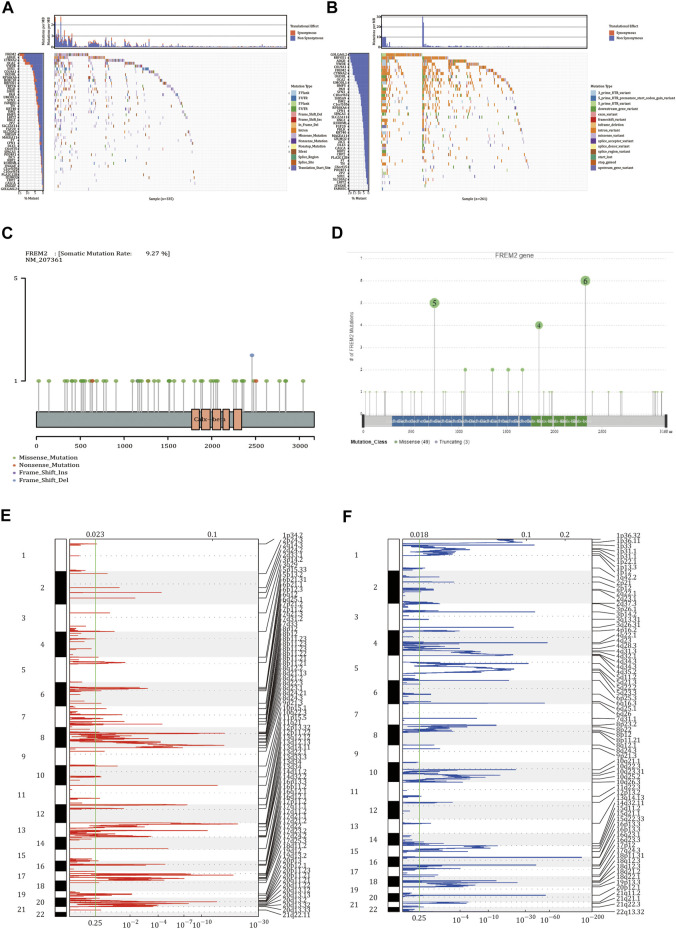
Somatic mutation and copy number variation analysis in colon adenocarcinoma (COAD) patients. (A) The 68 genes with the highest mutation frequency in COAD patients from The Cancer Genome Atlas (TCGA). (B) The mutations of 68 genes in the International Cancer Genome Consortium (ICGC) database. In the two waterfall charts, the left panel shown genes with high frequency mutations arranged according to their mutation frequency and the right panel shows different types of mutations represented by various color modules. (C) The mutations of FREM2 in TCGA cohort and (D) in the ICGC cohort. (E,F) Identification the amplification and deletion of FREM2. The mRNA located at the focal copy number alteration peak was related to COAD. The false discovery rate (Q value) and the change score of GISTIC2.0 (x-axis) correspond to the position of the genome (y-axis). The dotted line indicates the centromere. The green line represents the 0.25 Q value cutoff point for determining significance.

