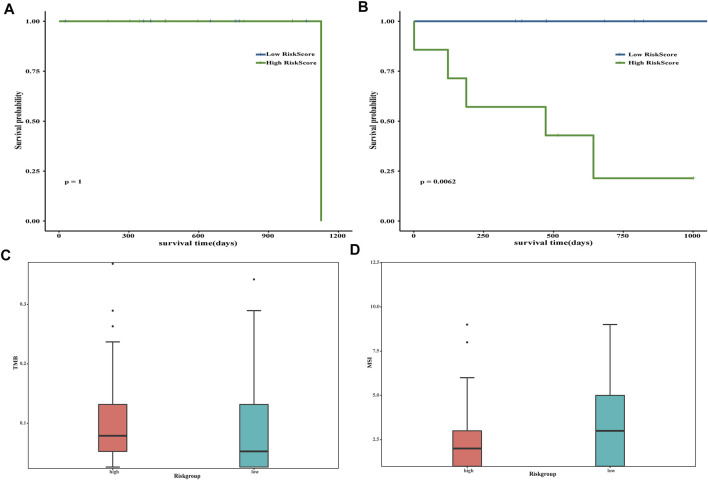
FIGURE 5.
Evaluation of risk score. The impact of risk scores on overall survival in the subgroup of inactivating mutations (A) and other non-silent mutations subgroups (B). Blue indicates low-risk scores, and green indicates high-risk scores. Correlation analysis between tumor mutation burden (C) and microsatellite instability (D) and risk scores. Pink is used to represent the group with high risk, whereas green represents the group with low risk.

