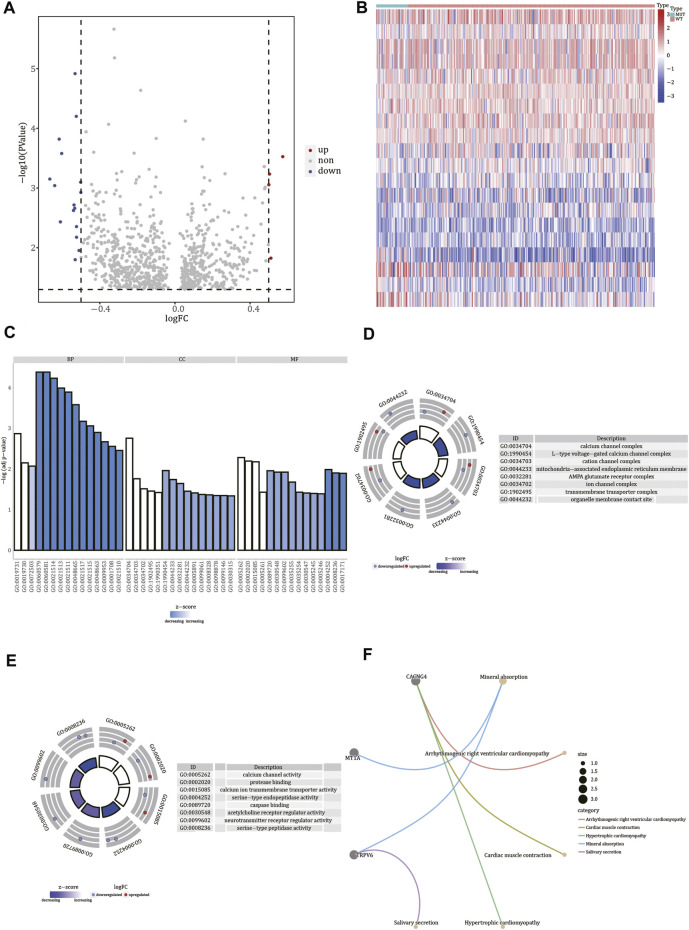
FIGURE 6.
Functional enrichment analysis of differentially expressed genes. (A) Volcano plot of differentially expressed genes. The red nodes indicate up-regulation, blue nodes indicate down-regulation, and gray nodes indicate non-significant expression changes. (B) Heat map of differentially expressed genes. Red represents high gene expression levels, blue represents low gene expression levels, green annotation bars indicate FREM2-mutant samples, and red annotation bars indicate FREM2-wild type samples. The result of Gene Ontology functional enrichment analysis of differentially expressed genes (C), and the results of molecular function (D) and cell compartment (E) terms enrichment analysis are displayed. Blue indicates down-regulation of expression, red indicates up-regulation of expression, the middle quadrilateral indicates the effect of the gene on the enriched Gene Ontology terms, light color indicates inhibition, and dark color indicates activation. (F) The top five pathways of Kyoto Encyclopedia of Genes and Genomes enrichment analysis of differentially expressed genes.

