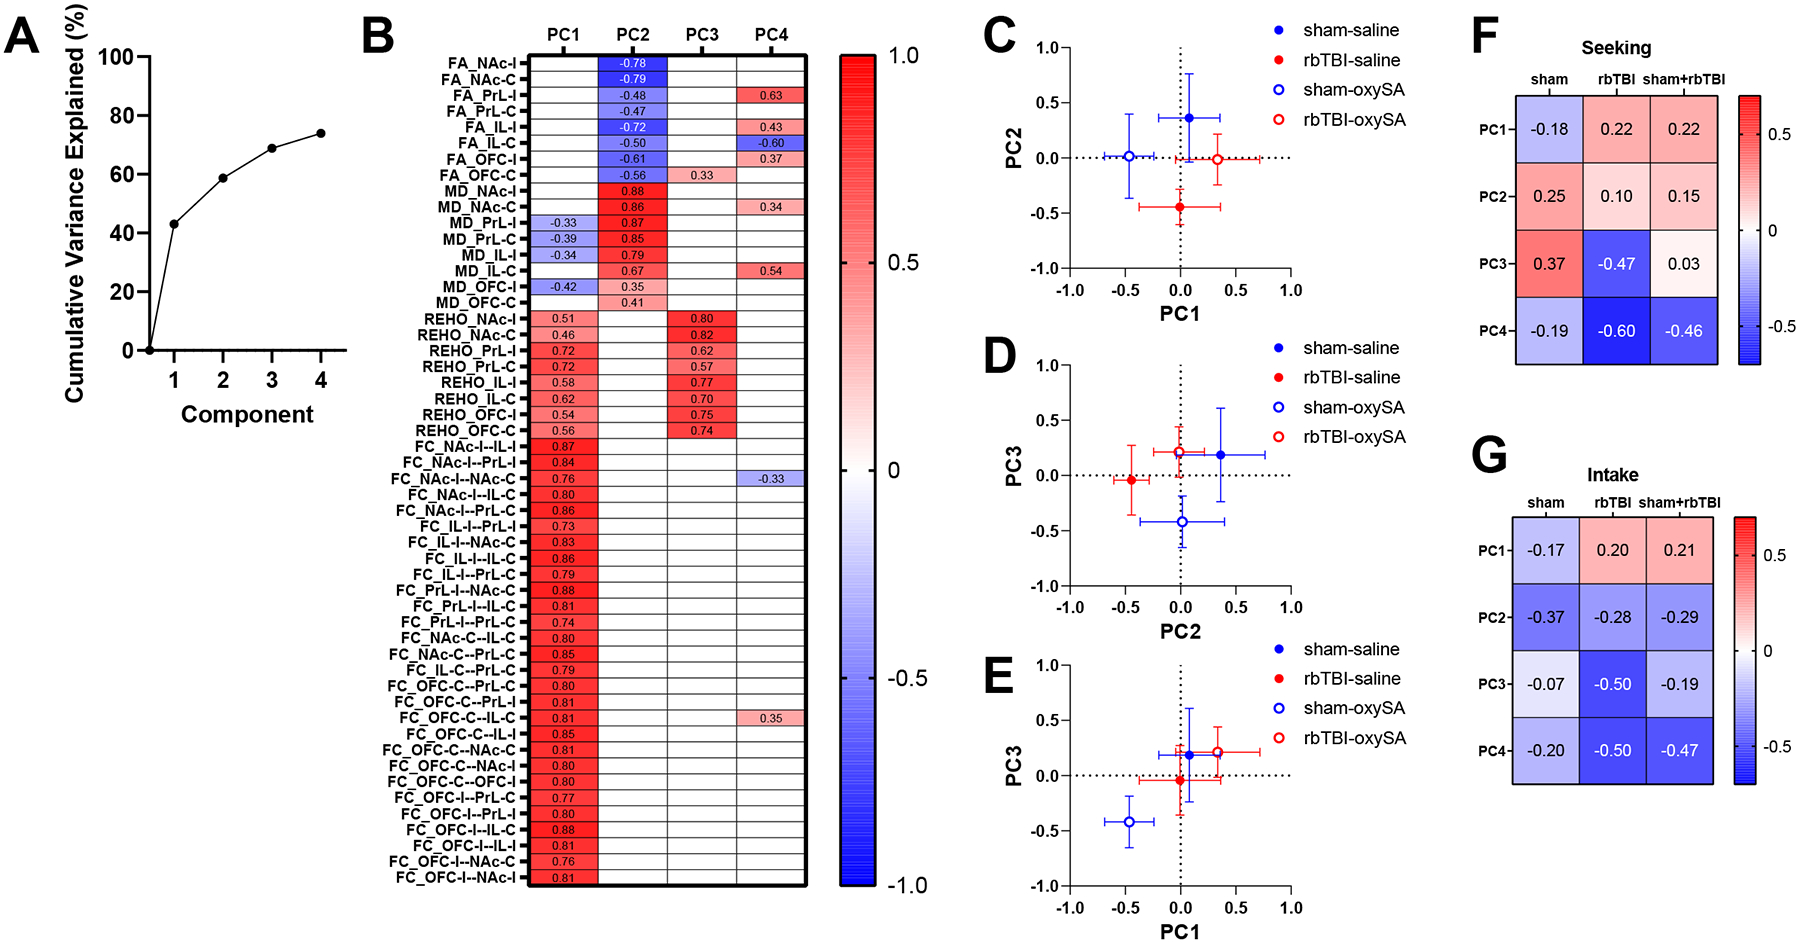
Figure 3:

Principal components analysis of MRI measures. A) Scree plot. B) Component loadings, C-E) Groups plotted against each pair of components 1–3 (plots with component 4 in Fig S1). F-G) Correlations between principal components seeking (PearsonÔÇÖs r, panel F) and oxycodone intake (SpearmanÔÇÖs rho, panel G). Symbols represent mean+-SEM. FA: fractional anisotropy, MD: mean diffusivity, REHO: regional homogeneity, FC: functional connectivity, PrL: prelimbic cortex, IL: infralimbic cortex, OFC: orbitofrontal cortex, NAc: nucleus accumbens. I, C: ipsi- or contra-lateral to injury, corresponding to left or right hemisphere, respectively in all rats.
