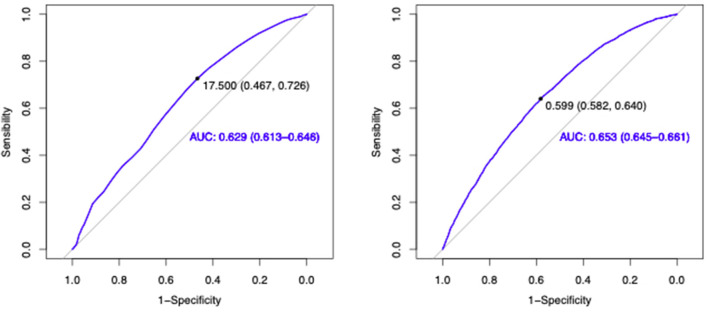
Figure 2.
ROC curves. Receiver operating characteristic (ROC) curves defining cutoff points for HS (A) and GS (B) as markers for cognitive impairment. The dot represents the point with the largest AUC. Area under the curve: (A) 0.629 (CI 95%: 0.613–0.646), (B) 0.653 (CI 95%: 0.645–0.661). AUC, area under the curve; HS, handgrip strength; GS, gait speed.

