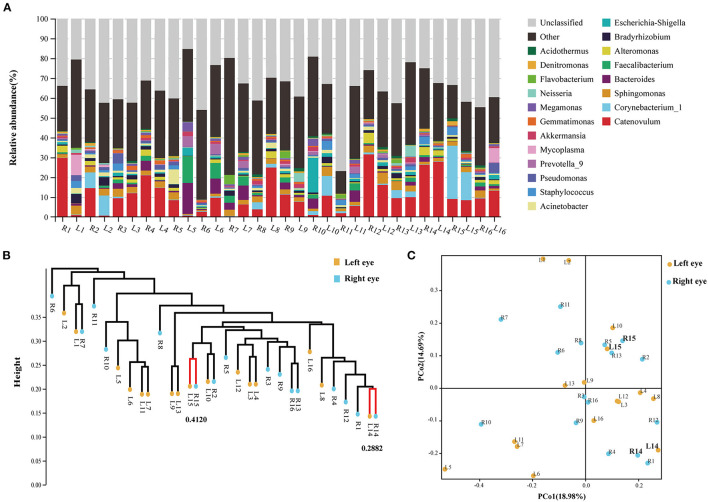
Figure 2.
Analysis of composition and dissimilarity of bacterial community between eyes within individual at baseline. (A) Stacking map of abundance of bacteria at baseline. 16S rRNA gene sequences were classified into genus levels. (B) Unweighted pair group method with arithmetic mean analysis (UPGMA) of all samples at baseline. (C) PCoA analysis between right (R) and left (L) eyes.

