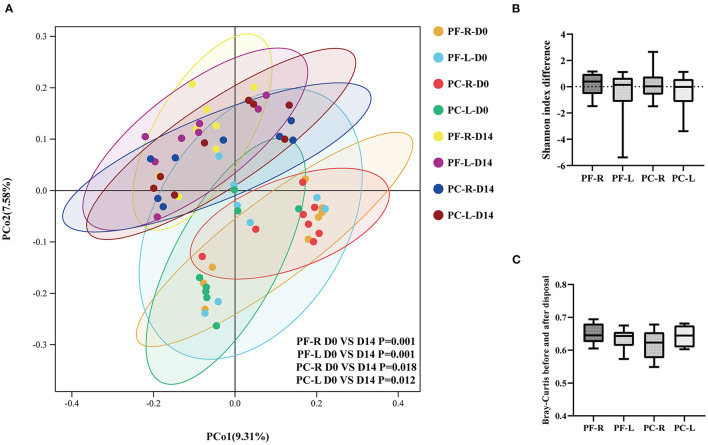
Figure 4.
Alpha and beta diversity analysis within the individuals and between the preservative-free (PF) and preservative-containing (PC) groups. (A) The PCoA plot based on the unweighted UniFrac distance index. (B) The differences in Shannon index between the repeated samples in each group. (C) Bray-Curtis indices between the repeated samples in different groups.

